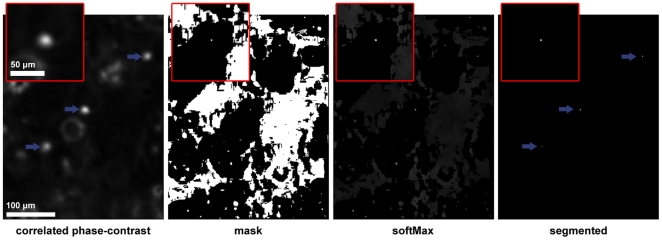
Figure 3. Cell detection in a correlated volume.
Illustration of (a part of) a single Z-slice containing 3 cells in focus (pointed by arrows) submitted to the different segmentation steps (correlated phase-contrast, mask, softMax and the final segmented volume). The magnified region of interest shown in the upper left corner of each image is centered on the cell located in the middle of the image.

