
Figure 8.
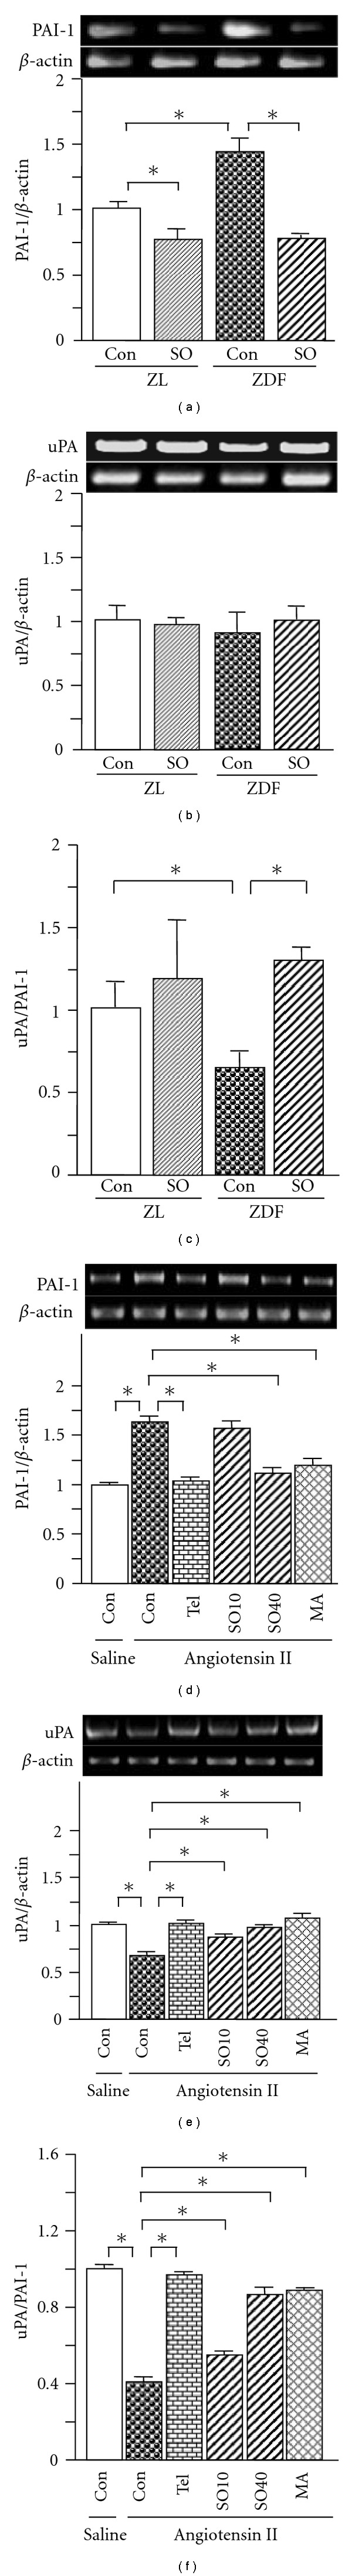
Renal expression of PAI-1 (a), uPA (b) mRNAs, and the ratio of uPA to PAI-1 (c) in ZL and ZDF rats, and levels of PAI-1 (d) and uPA (e) mRNAs, and the ratio of uPA to PAI-1 (f) in rat mesangial cells. In cell culture, SO (SO10: 10 and SO40: 40 μg/ml), MA (25 μM) or Tel (10 μM) was added 1 h prior to treatment with angiotensin II (10−6 M), followed by 24-h incubation. Total RNA was extracted from renal tissues and the mesangial cells using TRIzol, respectively. The relative levels of specific mRNAs were determined by RT–PCR. Results were normalized to β-actin. All values are means ± SEM (n = 5, each group in vivo; n = 3, each group in vitro). *P < .05.