
Figure 3. Peripheral-Blood B-Cell Counts.
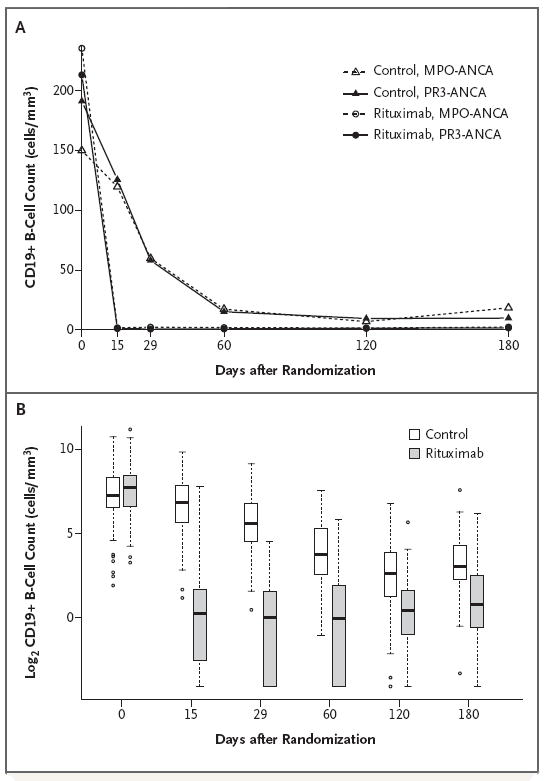
Panel A shows the peripheral-blood B-cell counts in the rituximab and control groups according to antineutrophil cytoplasmic antibody (ANCA) type. The counts in most patients who received rituximab decreased to less than 10 CD19+ cells per cubic millimeter after two infusions and remained at that level until 6 months. B-cell counts decreased more slowly in the control group than in the rituximab group and remained detectable, at low levels. MPO-ANCA denotes ANCA directed against myeloperoxidase, and PR3-ANCA ANCA directed against proteinase 3. Panel B shows box plots of log2-transformed values for CD19+ B cells at six time points, according to treatment group. The horizontal line within each box indicates the median value; the bottom and top lines of the box depict the 25th and 75th quartiles, respectively; and the whiskers show the upper and lower values at 1.5 times the interquartile range. The open circles represent values outside this range and are considered outliers. Values equaling 0 were converted to the lowest nonzero value of 0.06 before log2 transformation.