
Figure 1. Estimation of individual admixture in WHI African American and Hispanic American participants.
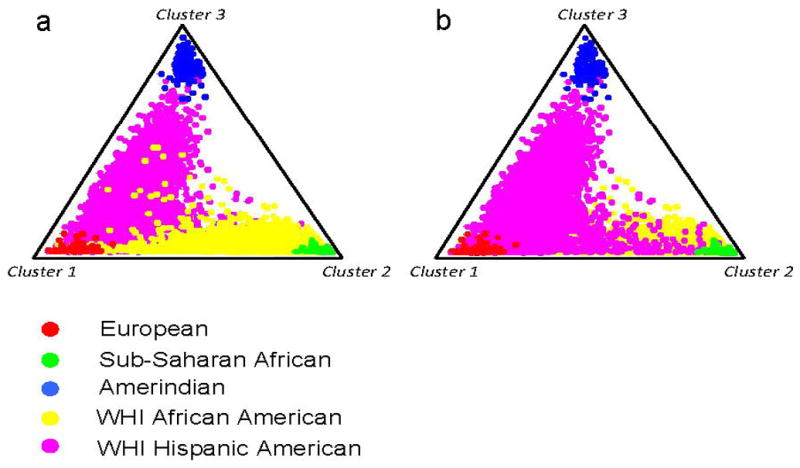
The triangle plots show the distribution of individual WHI participants and reference population representative when admixture was assessed using 92 ancestry informative markers (AIMs). The population groups European, sub– Saharan African, Amerindian, WHI African American (AFA), and WHI Hispanic American (HA) are as indicated by color coded symbols in the key. The admixture was assessed under a K=3 model (assuming 3 parental population groups) using the STRUCTURE program that applies a Bayesian clustering algorithm. Panels a and b show two separate analyses under the same conditions with either the AFA participants in the foreground (panel a) or the HA participants in the foreground (panel b).