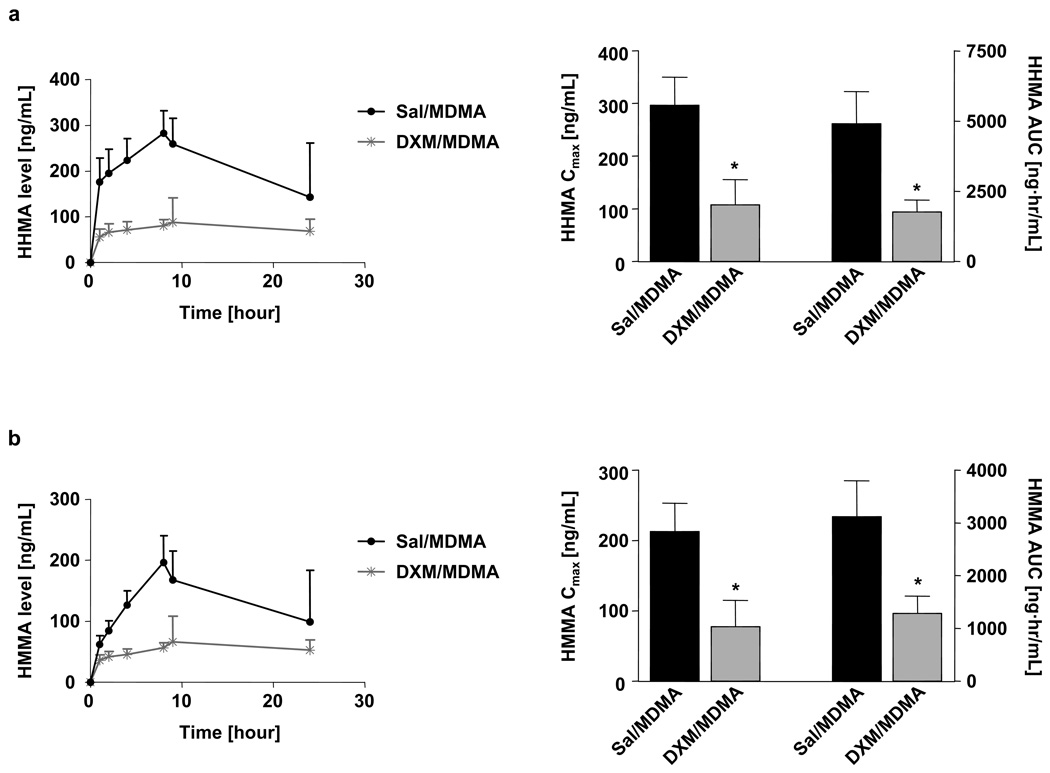
Fig. 2.
Plasma time-concentration profiles of HHMA (a) and HMMA (b) are shown on the left; corresponding pharmacokinetic parameters (Cmax and AUC) are shown on the right. Animals received an oral dose of 20 mg/kg MDMA. One group of rats received DXM (30 mg/kg i.p.) 1 and 0.25 hours before and 3 hours after MDMA; the other group received saline at the same time points. Values represent the mean ±SD (N=9–12 per group). Student’s t-test was performed and significance assumed when p<0.05.

