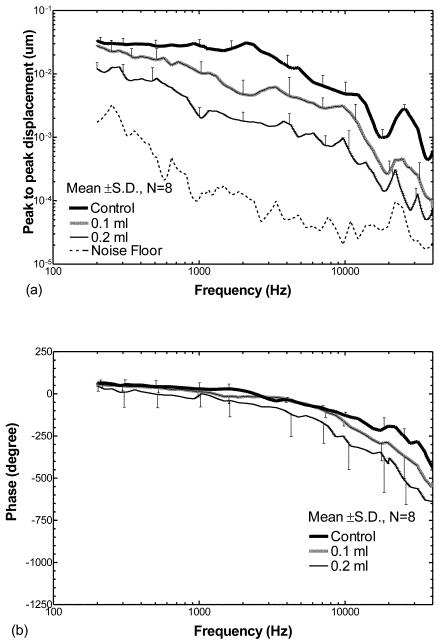
Figure 3.
Peak to peak displacement magnitude (a) and phase angle (b) of the TM (mean ± SD, N=8) in response to 80 dB SPL sound input at the ear canal when saline was injected into the middle ear cavity from 0 to 0.2 ml (filled the cavity). The bold lines represent the control curves; the grey lines represent the measurements on ears with 0.1 ml fluid in the middle ear; the thin lines represent the measurements on ears with 0.2 ml fluid.

