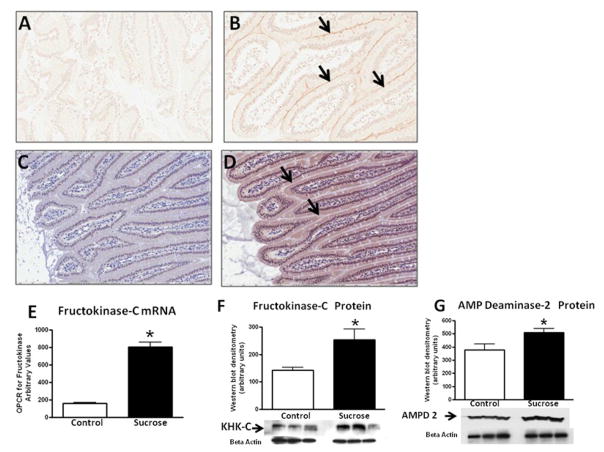
Figure 1. Expression of Glut 5 and Fructokinase.
Jejunal tissues obtained from starch and sucrose-fed rats were examined for the fructose transporter, Glut 5, and for fructokinase-C. In contrast to control rats (A), immunostaining showed the expression of Glut 5 along the apical border (B, light brown line highlighted by arrows). Compared to control rats (C), fructokinase was also increased in the cytoplasm of the sucrose-fed rats (D, brown colored cytoplasm, see arrows). Sucrose fed rats showed an increased hepatic expression of fructokinase mRNA (E), fructokinase protein (F) and AMP Deaminase 2 protein (G) compared to starch-fed rats. A and B, 40 x; C and D, 20x *p<0.05.

