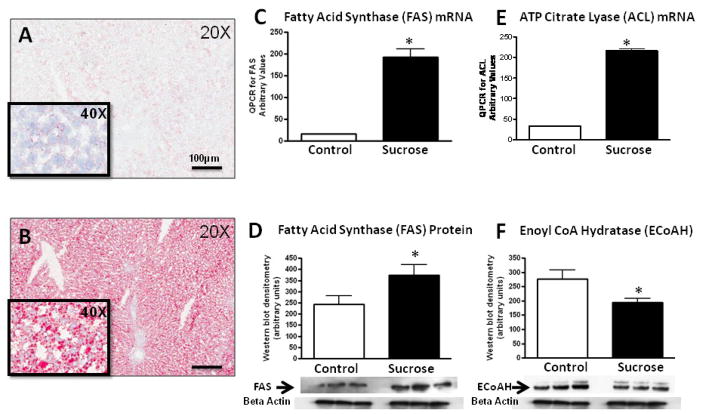
Figure 3. Effects of Diet on Fatty Liver.
Rat liver tissue obtained at 4 months shows negative staining for fat by Oil Red O stain in starch-fed, control rats (A) whereas diffuse micro and macrovesicular fat deposits are present in sucrose-fed rats (B). QPCR analysis of whole liver tissues shows an increase in Fatty acid synthase (C) and ATP Citrate Lysate mRNA (D) in Sucrose-fed rats. Western blots confirmed an increase in Fatty Acid Synthase protein (E) and a decrease in Enoyl CoA hydratase-1 protein in sucrose-fed rats (F). Key, A and B, Oil Red Stain, 20X magnification. *, p<0.05

