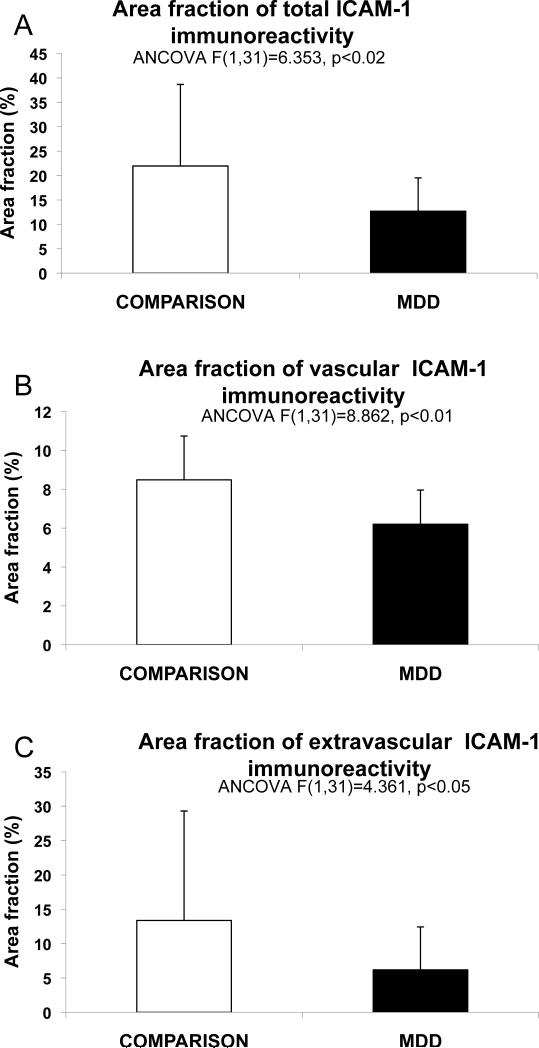
Figure 3.
Bar graphs representing the average total area fraction of all ICAM-1-IR structures combined (A), the area fraction of immunoreactive structures with vascular morphology (B), and the area fraction of extravascular patches of ICAM-1 immunoreactivity (C) in non-psychiatric comparison subjects (CONTROL) and subjects with MDD. Whiskers on top of the columns are error bars representing the standard deviation.

