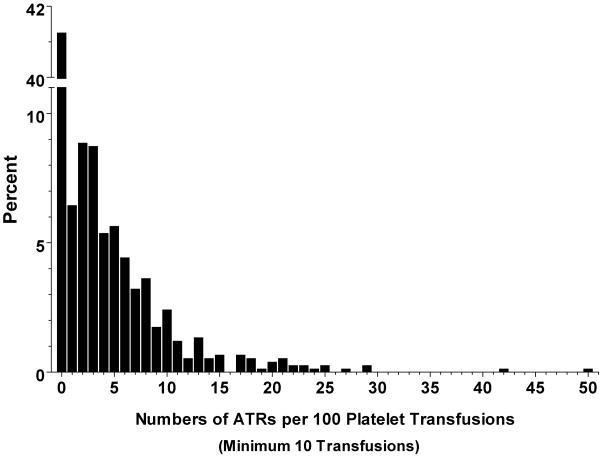
Figure 2. Per person rates of ATRs among recipients of ≥ 10 platelet transfusions.
Per person ATR rates were calculated as the number of ATRs/number of AP transfusions and normalized to a rate per 100 transfusions. The histogram shows percent of patients with ATR rates categorized into intervals of 1 unit on the x-axis.

