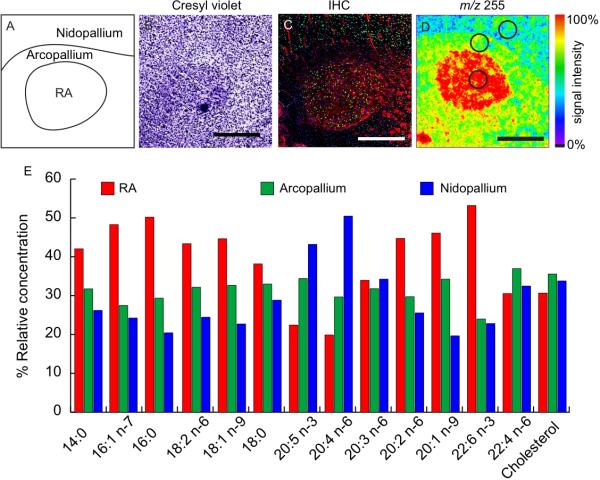
Figure 2.
Relative fatty acid concentration across an image of RA. (A) Illustration showing anatomical features across RA, (B) cresyl violet stained section showing cell distribution, (C) IHC showing cell distribution with DAPI (blue), neuronal distribution NeuN (green), myelin basic protein (red). (D) ToF-SIMS image showing the distribution of palmitic acid (16:0) across the RA. (E) The graph compares the relative concentration of different fatty acids between RA (red), the arcopallium (green), and nidopallium (blue). Spectra were collected by ROI, areas outlined in (D), normalized to the carbon ion, and expressed as a percentage of the total from the different regions of interest. Relative concentrations should only be compared between regions for a single fatty acid and not between fatty acids. Scale bar = 500 μm.

