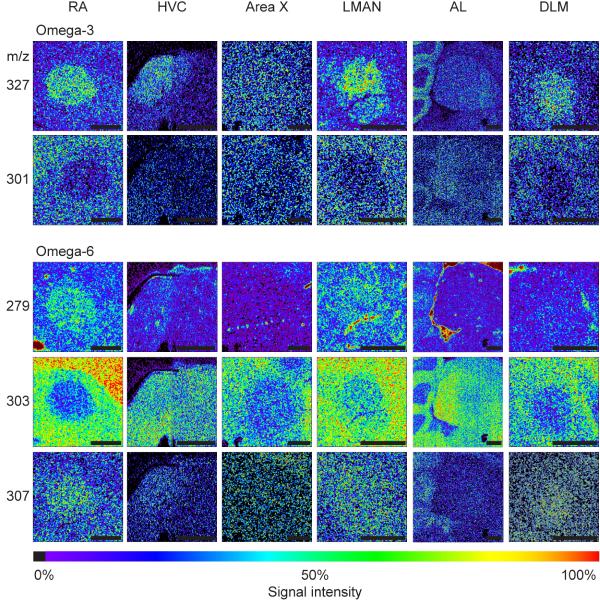
Figure 3.
ToF-SIMS images show the distribution of essential fatty acids collected across the song nuclei: RA, HVC, AreaX, LMAN, AL, and DLM. Omega-3 fatty acids—eicosapentaenoic acid (20:5 n-3, m/z 301), docosahexaenoic acid (22:6 n-3, m/z 327), and omega-6 fatty acids—linoleic acid (18:2 n-6, m/z 279), arachidonic acid (20:4 n-6, m/z 303), and docosadienoic acid (20:2 n-6, m/z 307). Images for 8,11,14-Eicosatrienoic acid (20:3 n-6), and adrenic acid (22:4 n-6) show no difference in spatial distribution across the song nuclei therefore were not included. All images have been scaled to a relative 0 - 100% intensity scale and their absolute ion count number may be different. Scale bar = 500 μm.

