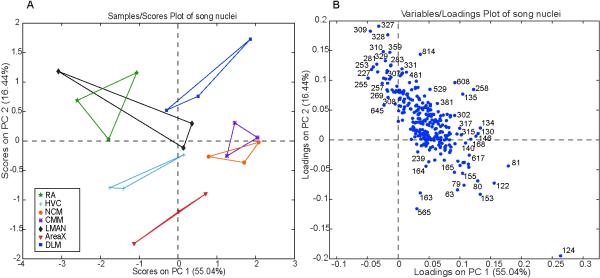
Figure 5.
Scores plot (A) from PCA using ToF-SIMS data collected from the different song nuclei. Each data point from a given song region represents data collected from a different adult brain. A line connects data representing the same song nuclei. Loadings plot (B) shows the masses responsible for the distribution of song nuclei in A.

