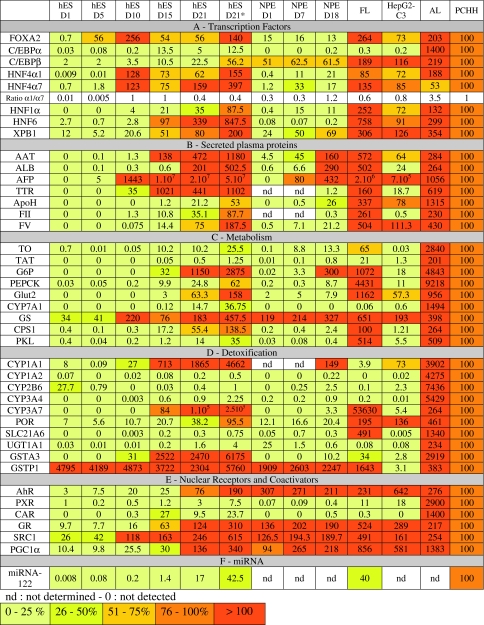
Table 1.
Quantitative RT-PCR analysis of mRNA expression of hepatic markers during hES differentiation (from D1 to D21) in comparison with NPE differentiation (D1 to D18), FL, AL and HepG2-C3. mRNA levels quoted in this table have been normalized with respect to corresponding levels in PCHH arbitrarily taken as 100

