
Figure 6.
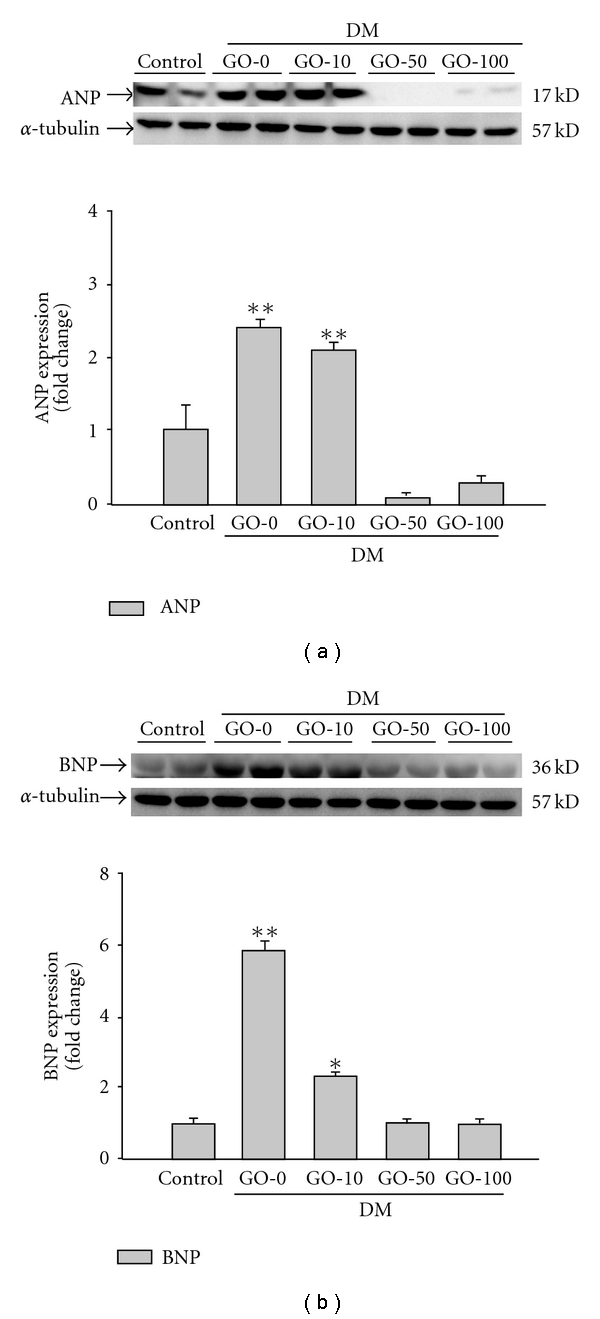
Detection of pathologic hypertrophy marker (a) ANP and (b) BNP protein level from the left ventricles in control and diabetic rats, analyzed by western blotting. GO-0, -10, -50 and -100 represent the doses of 0, 10, 50 and 100 mg garlic oil per kg BW. Signal intensity was quantitated using a PhosphoImager. Equal loading was assessed with an anti α-tubulin antibody. The average result ± SE of three independent experiments is shown. *P < .05, **P < .01 represent significant differences from control group.