
Figure 3.
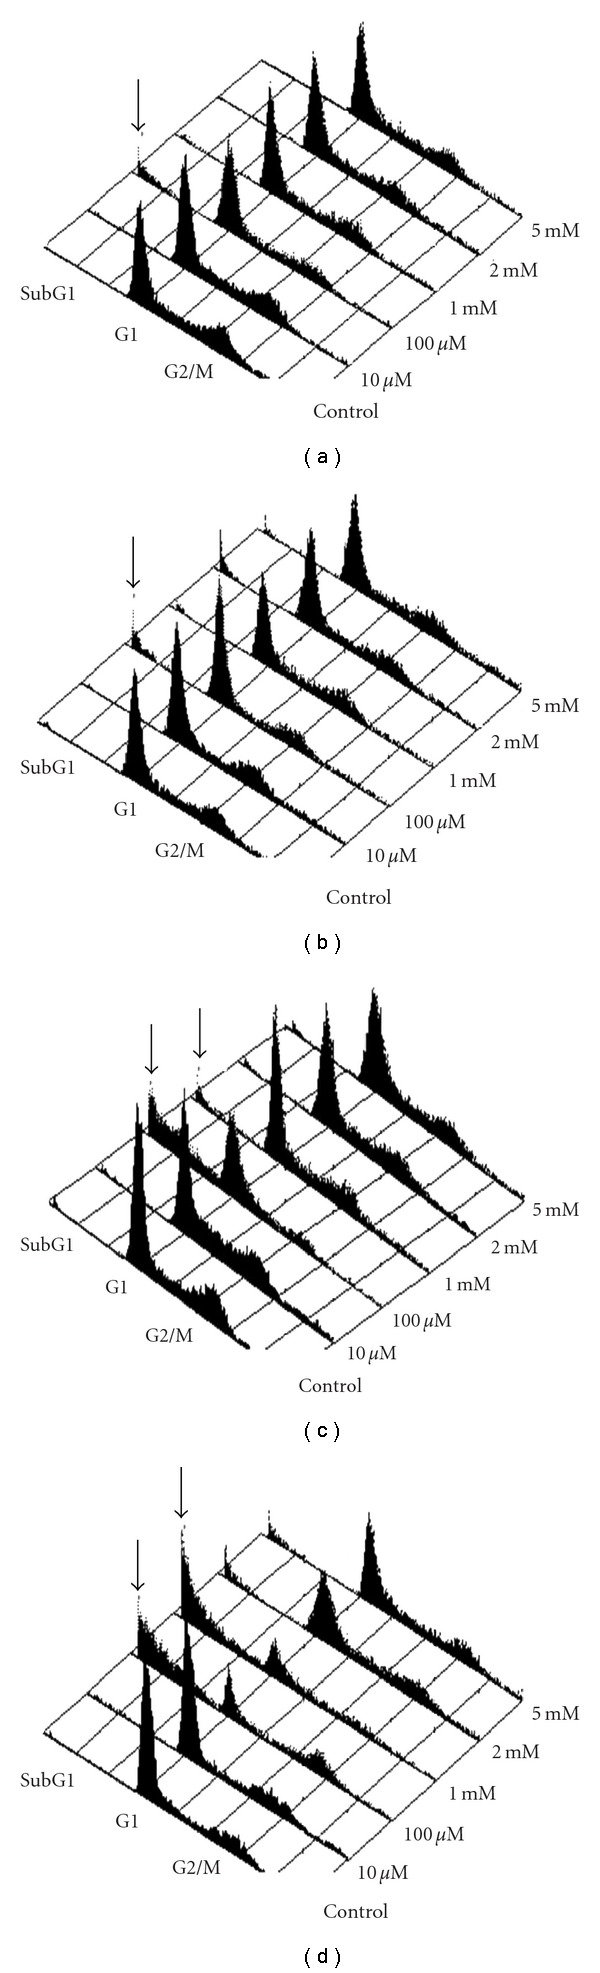
Cordycepin increased subG1 cell cycle phase in MA-10 cell line. The 3D histogram plot of flow cytometry analysis in MA-10 cells treated without or with cordycepin (10 μM to 5 mM) for 3 h (a), 6 h (b), 12 h (c) and 24 h (d), respectively. At the proper time points, cells were fixed, stained with propidium iodide, and analyzed of cell cycle progression by flow cytometry as described in Section 2. SubG1 = cells with less than normal amount of DNA content; G1, cells in G1 cell cycle phase; G2/M, cells in G2/M cell cycle phase.