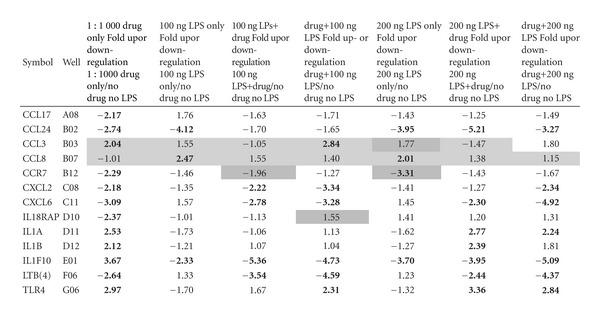
Table 1.
Gene expression profile of inflammatory markers expressing statistically significant fold change.

|
Values that have been highlighted showed weak amplification in qPCH; Light gray shadings indicates both control and test samples showed weak amplification; Dark gray shadings indicates only test sample shows weak amplification. Bold text indicates stastically significant fold changes.
