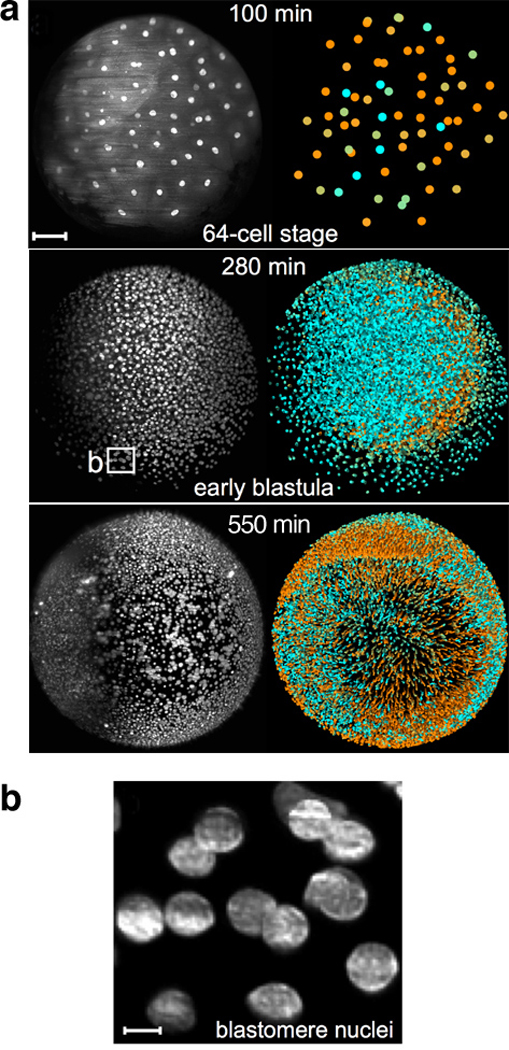
Figure 11.

Development of the zebrafish embryo imaged using GFP-labeled histones. (a) Positions and velocities of nuclei represented at three time points. At each time point, a 3D image is generated by acquiring a stack of 2D images (x and y dimensions) across a range of z positions. In the black-and-white images at left, the maximum intensity across the whole z-stack for every pixel in x,y space is plotted. Shading in the colored images at right indicates the velocities (cyan = slow; orange = fast) of single nuclei as determined by their relative position in adjacent frames. Scale bar = 100µm. (b) Individual nuclei from 280-minute sample in (a) can be imaged at very high resolution. Scale bar = 10µm. Figure reproduced from Reference (Keller et al 2008) with permission from Science.
