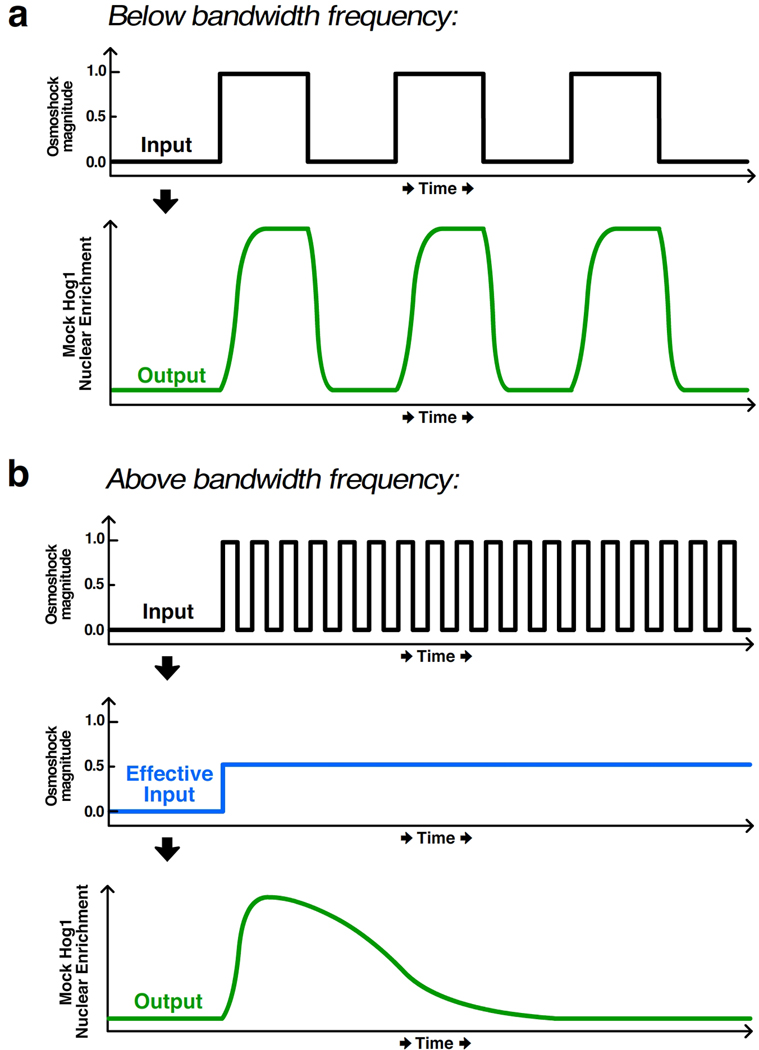
Figure 12.
Illustration of bandwidth as a measure of pathway responsiveness. (a) In both Hersen et al. and Mettetal et al., a microfluidic device delivered pulses of media with differing osmolyte concentrations (“Input” panel) to yeast cells, causing the activation and nuclear enrichment of the fluorescently tagged MAP kinase Hog1 (“Output” panel). Below the bandwidth frequency, the output tracks the input signal. (b) For input frequencies above the bandwidth, however, the cells cannot reliably process the input, leading to an “Effective Input” shown schematically in blue, which is approximately the integral of the input. The output very poorly represents the fluctuations in the input signal.

