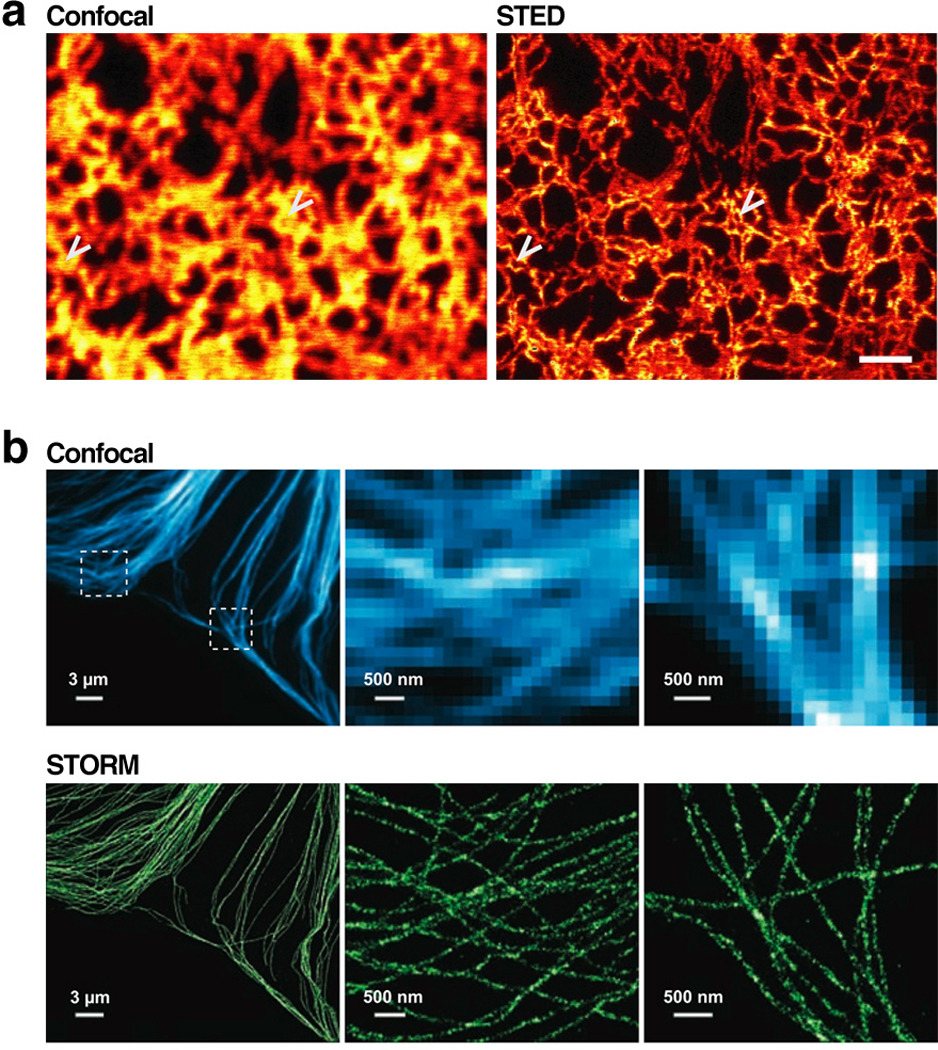
Figure 13.

Fluorescence imaging below the diffraction limit highlights features occluded even using confocal microscopy. (a) A yellow fluorescent protein fused to a sequence that targeted it to the endoplasmic reticulum was imaged using confocal microscopy (left) and stimulated emission depletion (STED, right). Arrows indicate positions where STED detects a ring in the ER structure not visible by confocal imaging. Scale bar = 1µm. (b) Comparison of immunofluorescence staining of microtubules using confocal microscopy (top) and stochastic optical reconstruction microscopy (STORM, bottom). The middle and rightmost panels are zoomed portrayals of the dotted boxes in the upper-left panel. The pixelation of these zoomed panels is apparent in the confocal images but not STORM, since STORM imaging can identify fluorophore positioning with considerably higher spatial resolution as compared to confocal imaging. Part (a) of figure reproduced from Reference (Hein et al 2008) with permission of PNAS, and part (b) reproduced from Reference (Bates et al 2007) with permission of Science.
