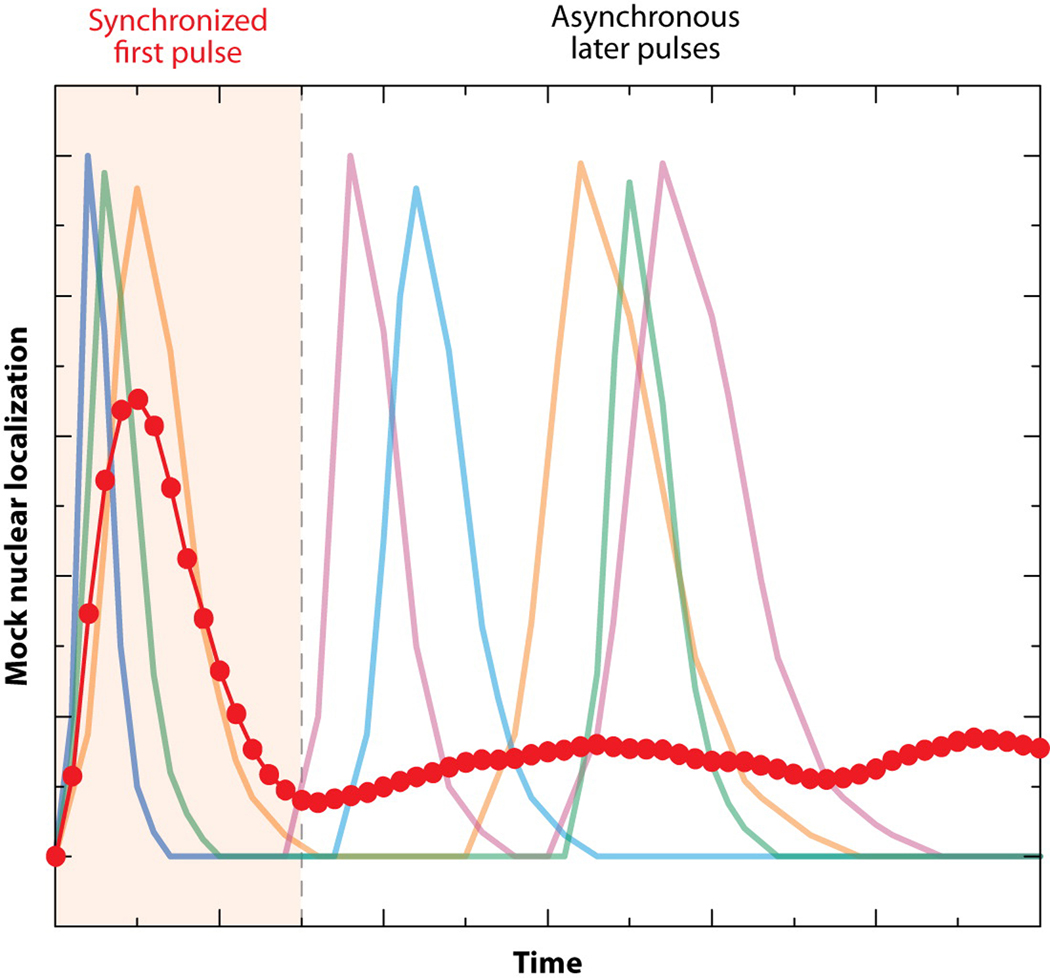
Figure 4.
One synchronized pulse followed by a series of unsynchronized pulses yields an average trajectory (dotted-blue line) that fails to represent single-cell activity (faded colored lines). Mock data is shown only for four hypothetical single cells, but the average trace was calculated from a simulation of 100 single cells. This schematic resembles the data of Cai et al., who quantified activity of Crz1-GFP by using image-analysis software to measure its nuclear enrichment in single cells.

