
Figure 8.
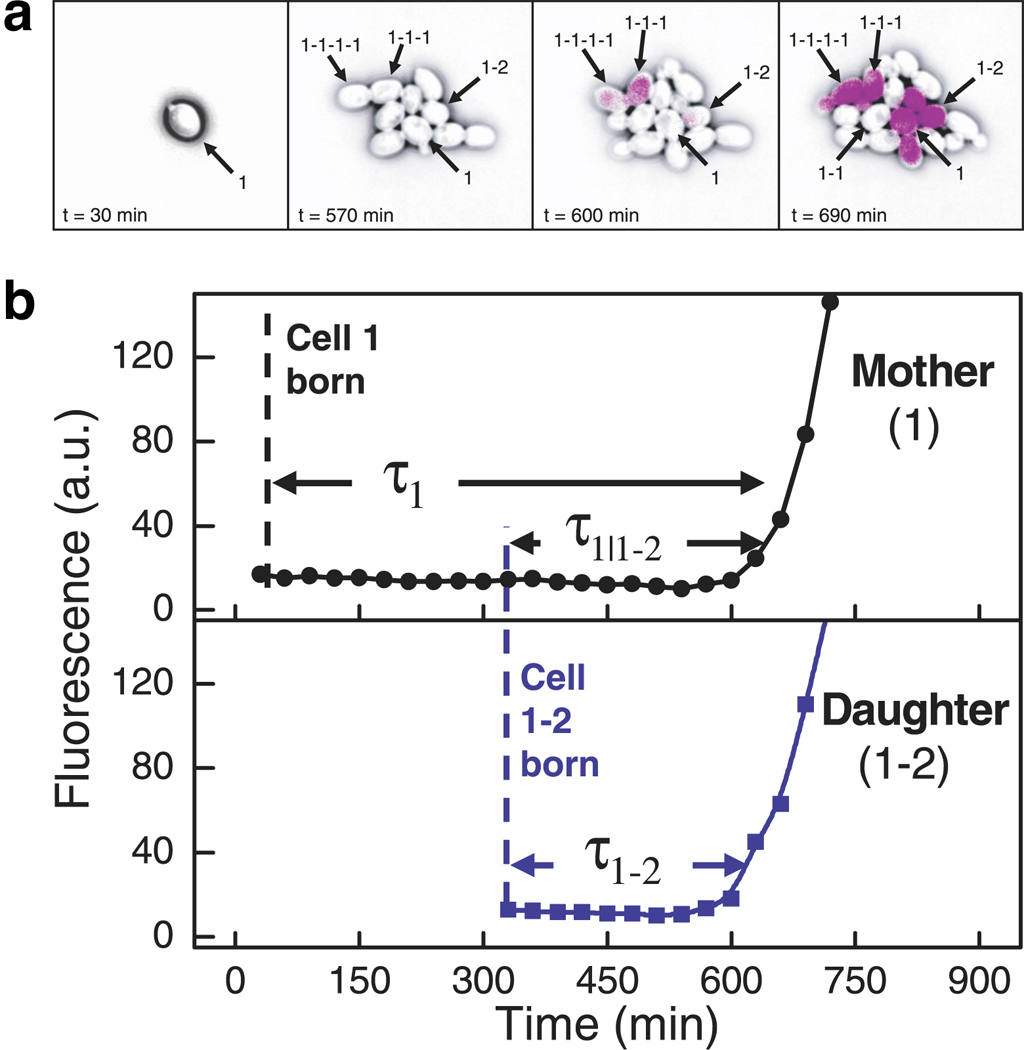
Correlated switching times among closely related single cells revealed via simultaneous monitoring of lineage and gene expression. (a) YFP expressed under control of the GAL1 promoter (GAL1-YFP) is shown in purple. Genealogy is indicated by the numbering scheme in which hyphens separate generations (e.g., 1-1-1 is the daughter of 1-1 and the granddaughter of 1), and the number indicates siblings (e.g., 1–2 is the sister of 1-1 and the second daughter of 1). Although all cells in the rightmost panel are close relatives of cell 1, only a subset expresses GAL1-YFP. (b) Quantification of GAL1-YFP expression in a mother and daughter shows that both switch to an expressing state nearly simultaneously. It was shown that related cells separated by up to four generations tended to activate GAL1-YFP expression at a similar time. Figure reproduced from Reference (Kaufmann et al 2007) with permission of PLoS Biology.