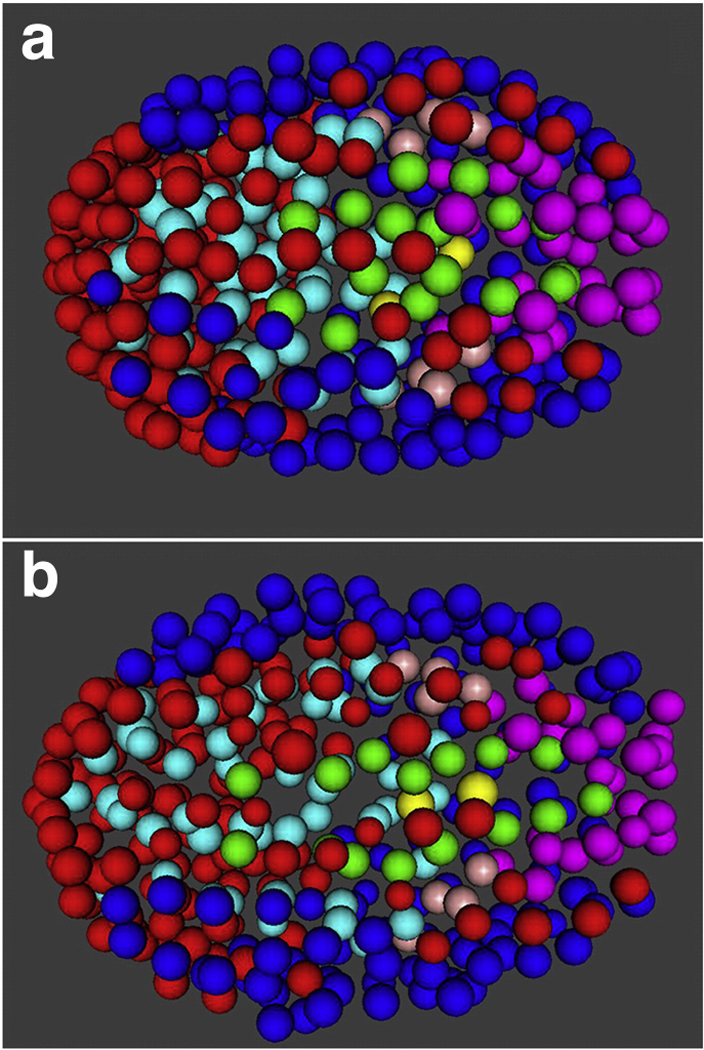
Figure 9.

Lineage comparison reveals developmental similarities between C. elegans (a) and C. briggsae (b) embryos. Spots represent nuclei, which were visualized via GFP-labeled histones and tracked computationally in 3D over time. Color-coding indicates descendants of a common precursor cell. Figure reproduced from Reference (Zhao et al 2008) with permission of Developmental Biology.
