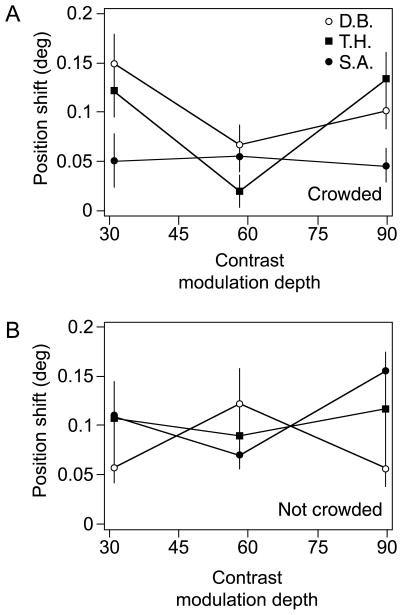
Figure 5.
Results of the first experiment. (A) The graph shows the second-order motion-induced position shift at three contrast modulation depths when crowders were present. Subject T.H. did not show a significant PSE at the midcontrast (0.58), but all other PSEs were significantly above zero; the least of the significant PSEs was for D.B., at the 0.58 contrast condition, χ2(1) = 8.81, p < .01. (B) The second-order motion-induced position shift without crowding. Each PSE was significant; the least significant of which was for subject T.H. in the 0.31 contrast condition, χ2(1) = 6.87, p < .01. There was no significant difference in the PSEs with and without crowding, F(1,2) = 0.37, p = .61. Averaged across both conditions, the perceived misalignment was ~0.10°, which is just above threshold vernier discrimination at the tested eccentricity and separation (Klein & Levi, 1987; Levi & Klein, 1990; Levi, Klein, & Aitsebaomo, 1985). Error bars denote ±SE of nonlinear regression.

