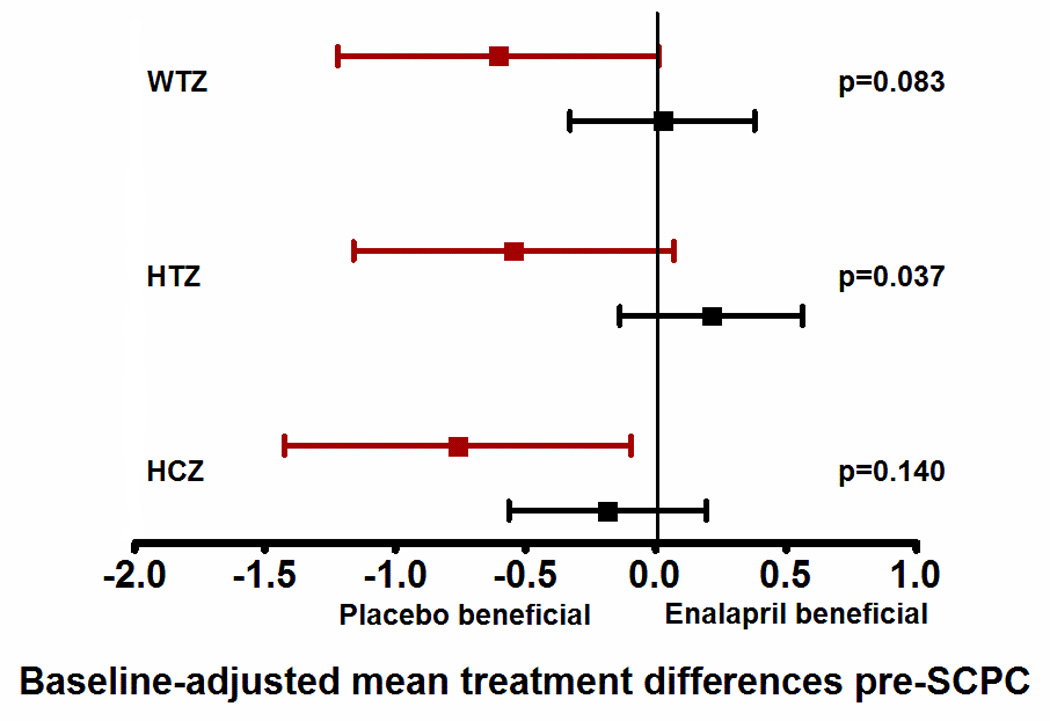
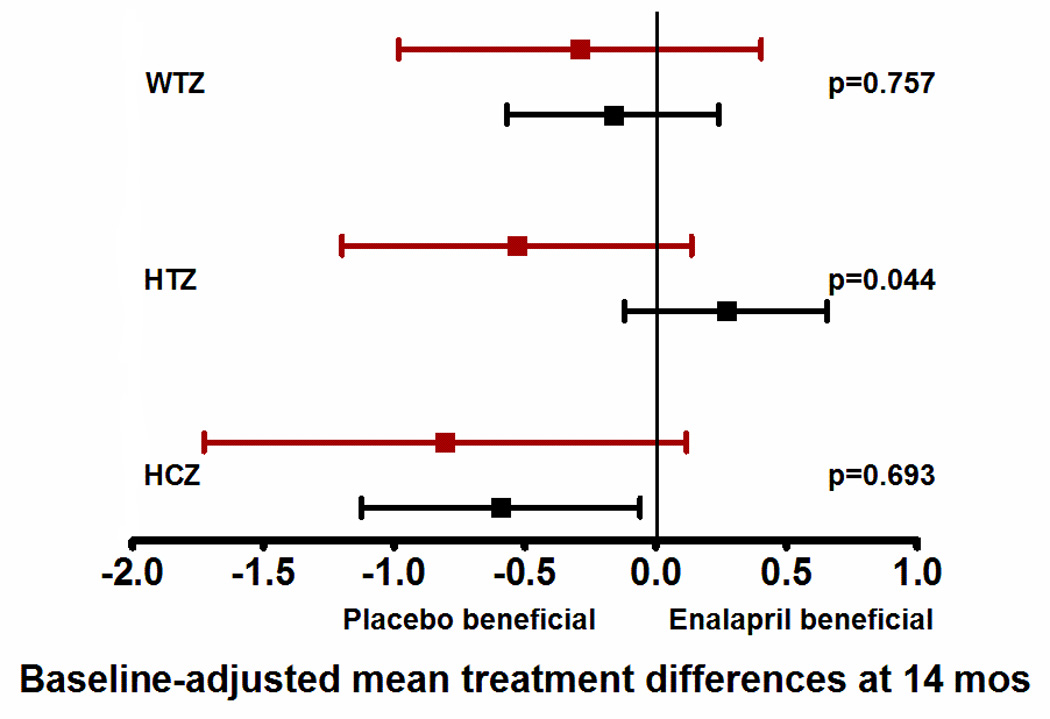
Figure 4.


This figure shows the differences in growth z-scores between the enalapril and placebo treated patients in the two risk groups (high-risk shown in red, and low-risk shown in black) at two time points - at pre-SCPC and final study visits. Data are shown as mean and 95% confidence intervals, adjusted for baseline z-scores. Mean values to the left of zero indicate lower z-scores in enalapril-treated patients i.e. placebo-beneficial; mean values to the right of zero indicate higher z-scores in the enalapril-treated patients i.e enalapril-beneficial. The interaction p values represent the differences in treatment effect between the high and low risk groups. There was no treatment effect on weight, height or head circumference in the low-risk group (black) at pre-SCPC (panel a), and at 14 months (panel b). However, high-risk patients (red) receiving enalapril had lower height z-scores at pre-SCPC, and at 14 months compared to placebo group. n=63, enalapril-treated low risk; n=53, placebo-treated low risk; n=18, enalapril-treated high risk; n=20, placebo-treated high risk. *p<0.05 enalapril vs placebo.
SCPC = Superior cavopulmonary connection, WTZ = weight z-score; HTZ = height z-score; HCZ = head circumference z-score.
