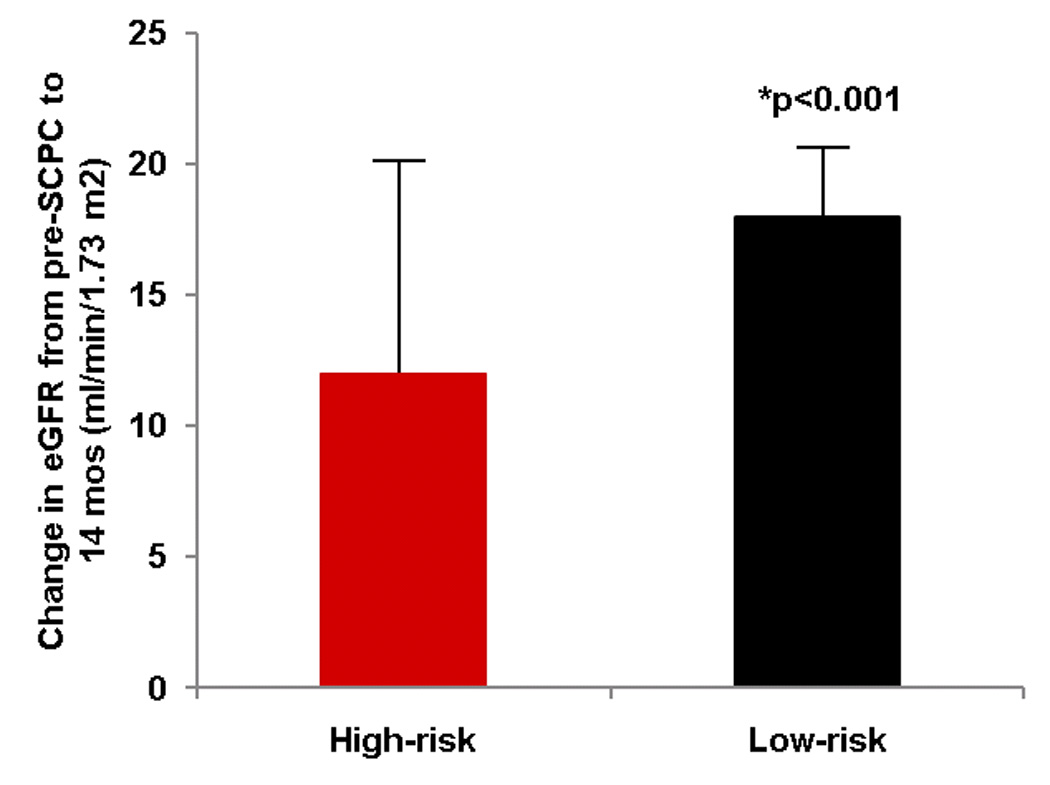
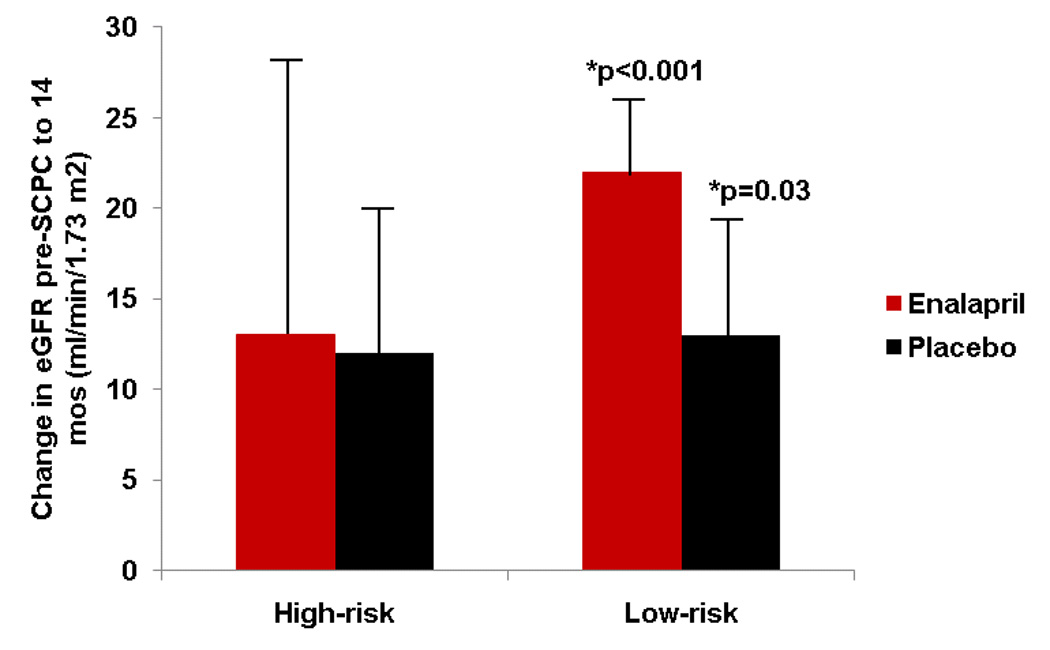
Figure 5.


(a) Mean change ± standard error in estimated glomerular filtration rate (eGFR) (14 months minus pre-SCPC). eGFR increased in the low-risk (black, n=85) but not in the high-risk group (red, n=26); *p<0.05 for change score from pre-SCPC. (b) The increase in eGFR in the low-risk group was independent of treatment with enalapril (red) versus placebo (black). High-risk/enalapril = 11; high-risk/placebo 15, low-risk/enalapril = 48; low risk/placebo = 37. *p<0.05 for change score from pre-SCPC.
SCPC = Superior cavopulmonary connection; eGFR = estimated glomerular filtration rate
