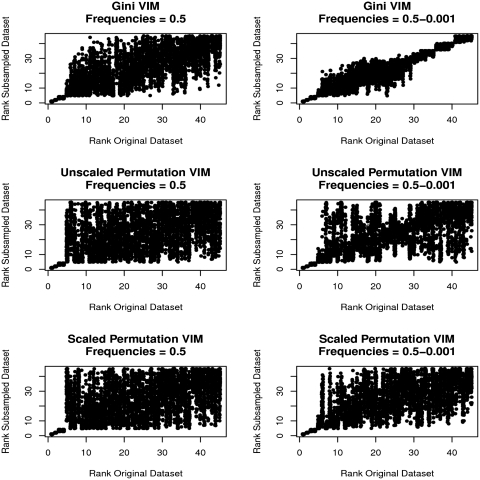
Figure 1:
MDG, MDA and MDAscaled rankings of predictors in 100 90% subsamples versus rankings from the full data set with equal and varying predictor category frequencies. Left column: ranks for five associated predictors with minor category frequencies of 0.5; right column: ranks for five associated and 40 unassociated predictors with frequencies ranging from 0.5 to 0.001. Top row: MDG; middle row: MDA; bottom row: MDAscaled.

