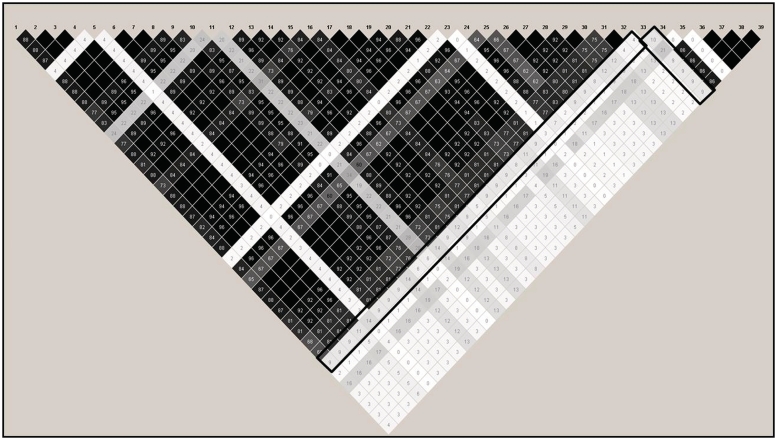
Figure 2:
LD plot for the top-ranked SNP using MDG under H0. Black box around pairwise correlation (r2) values for the top-ranked SNP using MDG. Shading indicates strength of r2 values, with black indicating perfect LD (r2 of 1.0) and white boxes indicating no correlation (r2 = 0). Grey boxes indicate intermediate values.

