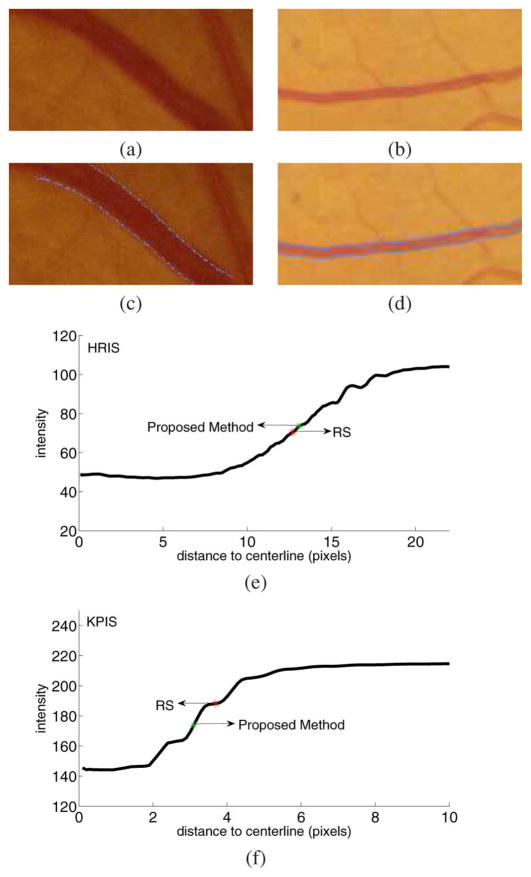
Fig. 7.
Vessel width measurement on vessel segments with different resolutions. (a) One test vessel segment from HRIS. The length of the vessel segment is 173 pixels. (b) One Test vessel segment from KPIS. The length of the vessel segment is 226 pixels. (c) The vessel width measurement result of (a). If the detected edge is not at an integer location, the nearest integer coordinate is shown. (d) The vessel width measurement result of (b). If the detected edge is not at an integer location, the nearest integer coordinate is shown. (e) The cross-sectional view of vessel intensity with regard to the distance to the centerline for (a). The black curve is the average of 173 normal profiles in the vessel segment. Intensities at noninteger locations are linearly interpolated. The red star is the average vessel width across the whole vessel segment marked by observers. The green star is the average vessel width across the whole vessel segment measured by proposed method. The two boundaries are flipped and shown in one figure. (f) The cross-sectional view of vessel intensity with regard to the distance to the centerline for (b). The black curve is the average of 226 normal profiles in the vessel segment. Intensities at noninteger locations are linearly interpolated. The red star is the average vessel width across the whole vessel segment marked by observers. The green star is the average vessel width across the whole vessel segment measured by proposed method. The two boundaries are flipped and shown in one figure.

