
Figure 4.
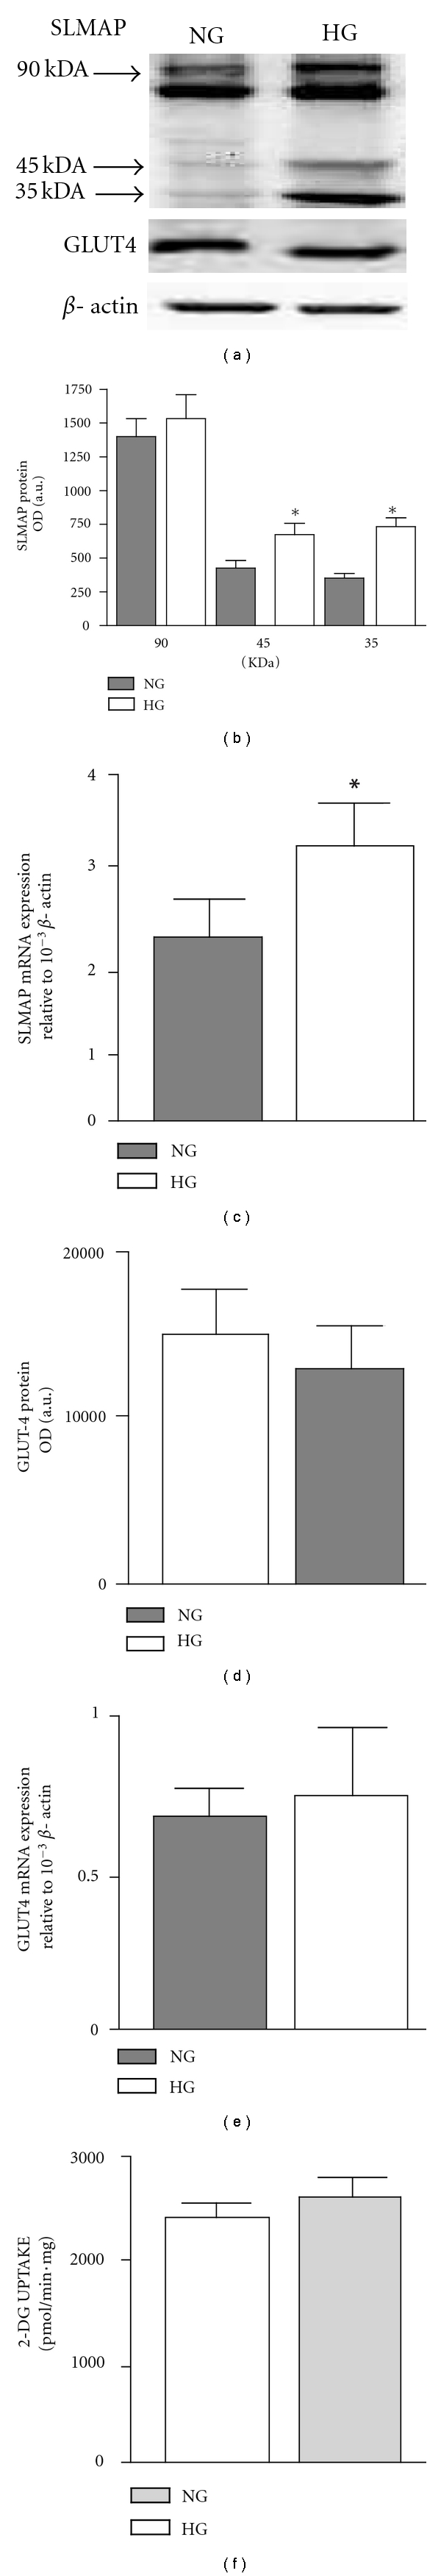
SLMAP expression in adipocytes. Representative gels for protein expression of SLMAP, GLUT-4, and β-actin in adipocytes cultured with 10 mM (NG) and 30 mM glucose (HG) for 3 days by Western blot method (a); data quantified by densitometry and are shown as bar graph for SLMAP (b) and GLUT-4 (d). Real-time PCR for SLMAP (c) and GLUT-4 (e) message normalized to β-actin from both adipocytes cultured with NG and HG for 3 days. Glucose uptake was measured in both adipocytes treated with NG and HG using radiolabeled 2-Deoxy-D-Glucose and data expressed in the bar graphs (f). *Significantly different (P < 0.05) n = 4.