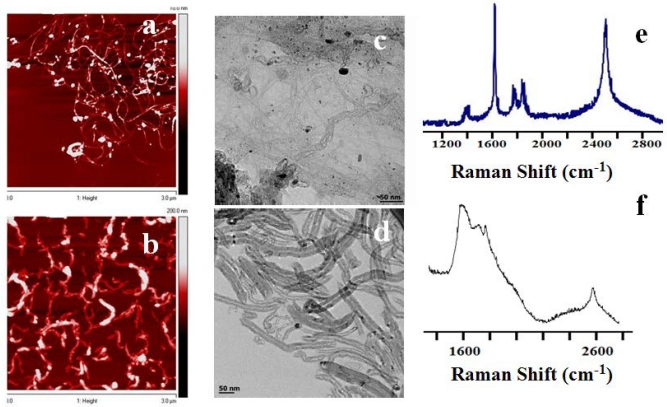
Figure 1.
AFM, TEM and Raman analysis of SWCNTs/MWCNTs dispersed in PL-PEG-NH2. AFM imaging of SWCNT (A) and MWCNT (B) samples on freshly peeled Mica surface. The 300 nm XY scale bar applies to both A and B, and the gray scales for topological height are 0 - 7 nm for A and 0 - 100 nm for B, respectively. The tube height in the SWCNT sample ranges from 0.7 to 1.5 nm. In contrast, the cross section heights in the MWCNT sample range from 10 to 30 nm. Whereas some SWCNTs are longer than 1 μm in length, MWCNTs are somewhat shorter. (C, D) TEM images of the SWCNTs/MWCNTs show well dispersed nanotubes. (E, F) Raman spectroscopic analysis of the LP dispersed SWCNTs and MWCNTs at a laser excitation of 785 nm. Raman spectra of LP dispersed SWCNTs (left) show the signature G band at ~1590 cm-1 and G' band at ~ 2600 cm-1 which are used to detect the nanotubes in the cells. Raman spectra of LP dispersed MWCNTs also show the respective G and G' peaks (right).

