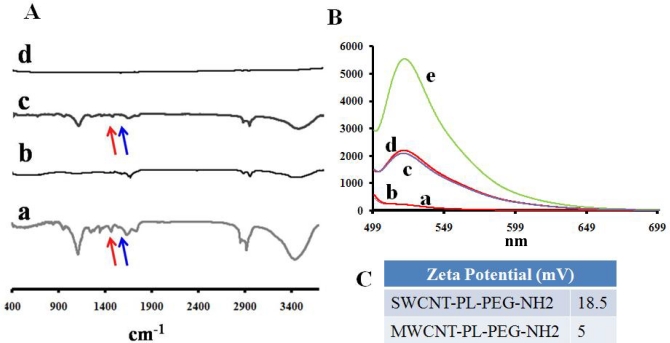
Figure 2.
FTIR and fluorescence spectroscopic characterization and surface charge analysis of PL-PEG-NH2 dispersed SWCNTs/MWCNTs. FTIR spectra on the left show the spectral changes occurring to pristine SWCNTs (Ab) and MWCNTs (Ad) after treatment with phospholipid-PEG (LP) dispersant. SWCNTs (Aa) and MWCNTs (Ac) show the amine peaks (C=O, red and N-H, blue) at around ~1500 - 1700 cm-1. Fluorescence spectra of LP dispersed SWCNTs (Ba) and MWCNTs (Bb) do not show any fluorescence while FITC labeled SWCNTs (Bc) and MWCNTs (Bd) fluoresce at 520 nm along with control FTIC alone (Be). Zeta potential analysis shows a positive surface on LP dispersed nanotubes (C).

