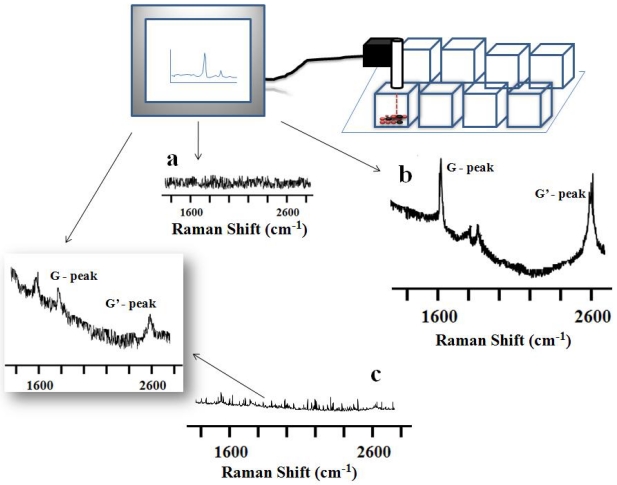
Figure 4.
Raman spectra of SWCNT-PL-PEG-NH2 and MWCNT-PL-PEG-NH2 in 2D cell culture in vitro. OVCAR8 ovarian cancer cells treated with LP dispersed SWCNTs and MWCNTs for 3 hrs and washed were subjected to Raman analysis to detect the presence of nanotubes using a handheld portable iRaman spectrometer with a 785 nm laser source. (A) Untreated cells, serving as controls, did not show any characteristic CNT peaks. The SWCNTs (B) and MWCNTs (C) treated cells indeed showed the characteristic G peaks.

