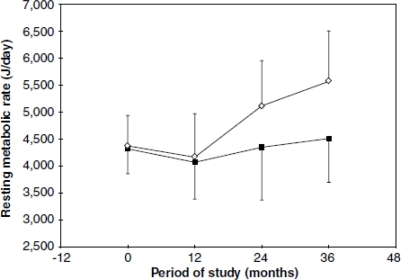
Figure 1.
Resting metabolic rate (J/day) (mean7s.d.) over the follow-up time (nonstunted ⋄; stunted ▪). ANOVA: group factor (F (1.20) = 3.04; P = NS), time factor (F (3.60) = 12.7; P < 0.001), and interaction factor (F (3.60) = 4.7; P = 0.005). Reprinted with permission from Eur. J. Clin. Nutr. [45].

