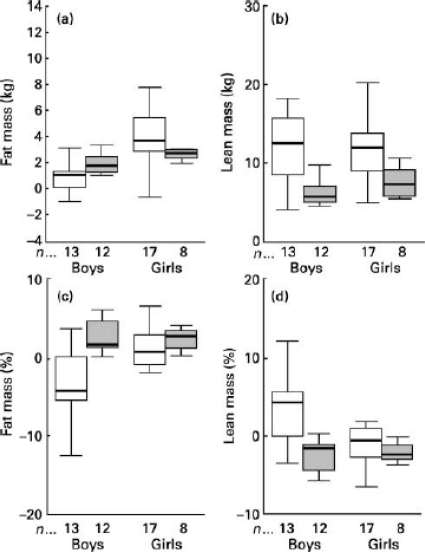
Figure 3.
Changes in body composition of stunted (
 ) and nonstunted children (□) (overall group) between the two study visits. (a) fat mass; (b) lean mass; (c) fat mass percentage; (d) lean mass percentage. The boxes represent the interquartile ranges, which contain 50% of values; the whiskers are the highest and lowest values (excluding outliers), and the line across each box indicates the median. Reprinted with permission from Brit. J. Nutr. [26].

