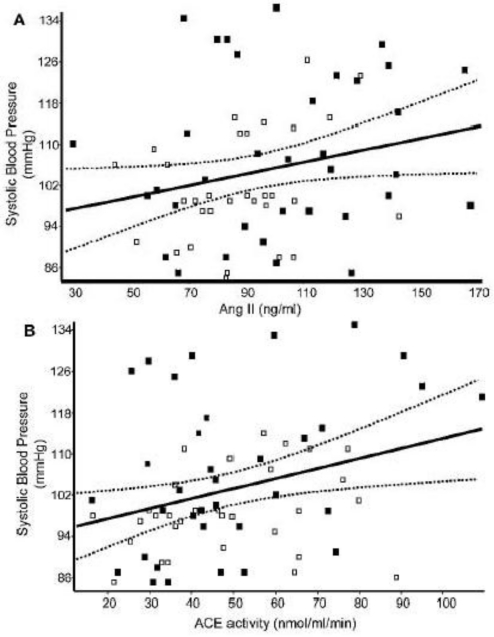
Figure 4.
Correlation between SBP and (A) AngII and (B) ACE activity for girls (open symbols) and boys (solid symbols). The solid lines represent the linear regression and the broken lines are the 95% confidence intervals. Reprinted with permission from Clin. Sci. [67].

