Figure 1.

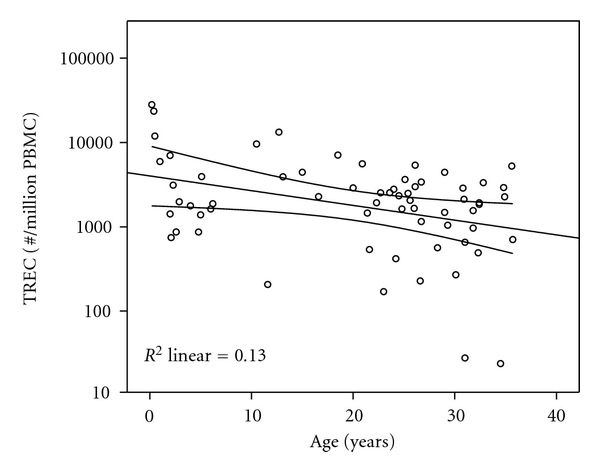
TREC values versus age for subject classification. Age adjusted mean and 99% confidence interval for the mean are displayed. Subjects with TREC values falling below the 99% confidence interval are included in the “low TREC” group.

TREC values versus age for subject classification. Age adjusted mean and 99% confidence interval for the mean are displayed. Subjects with TREC values falling below the 99% confidence interval are included in the “low TREC” group.