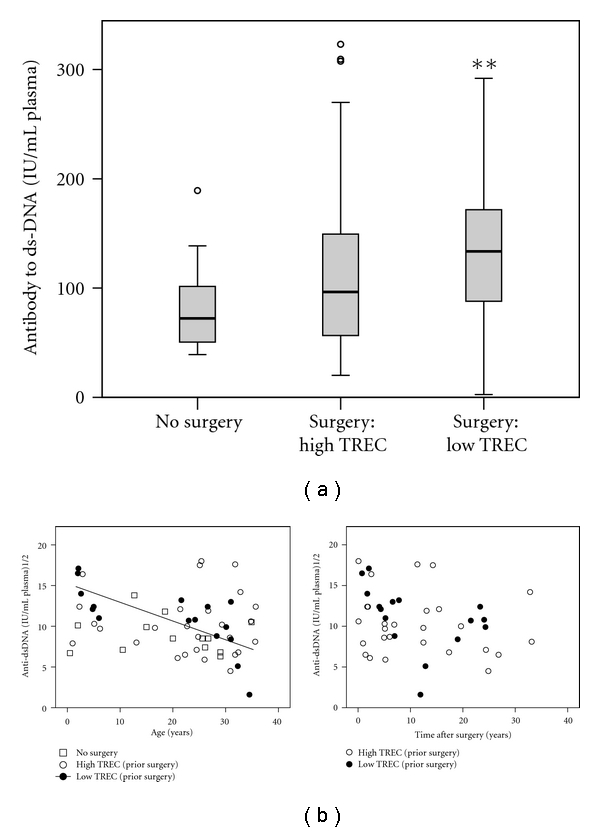
Figure 2.

Anti-dsDNA. (a) Anti-dsDNA antibody levels are displayed. Levels were compared between groups using the Wilcoxon rank sum test (**P = .03 versus No Surgery; 2-tailed asymptotic). (b) Square root transformed anti-dsDNA levels are plotted by age (left panel) and time after last surgery (right panel). Associations were examined using linear regression and the significant trendline for the “low TREC” group is displayed (P = .002, adj R2 = .477). For the other groups there is no significant association between anti-dsDNA level and age or time since last surgery.
