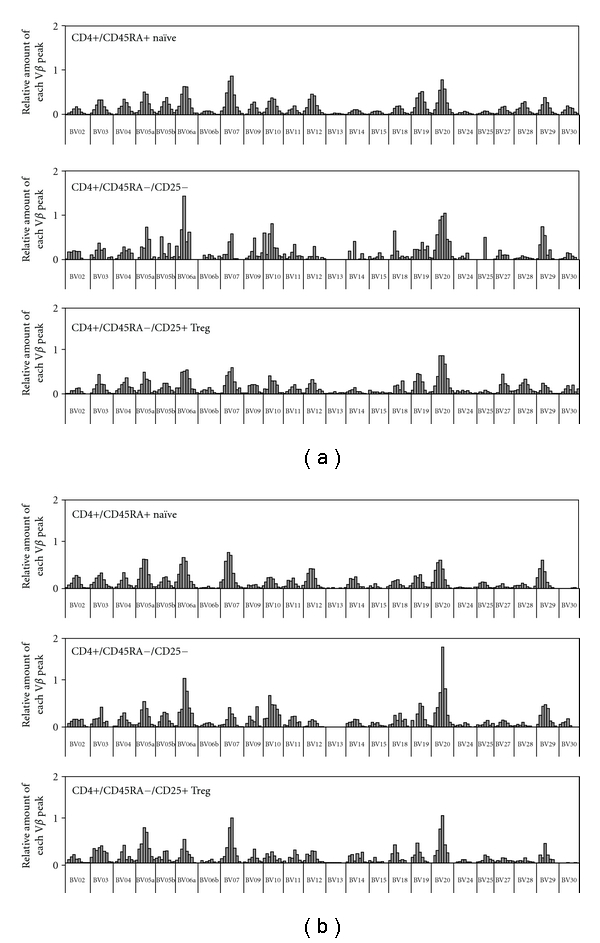
Figure 6.

Histogram representations of spectratype for CD4+ T-cell subpopulations. Representative data from 2 subjects is displayed. Distribution of peak lengths for all Vβ families for an 18-year-old with no surgery (a) and a 2-year-old after multiple prior surgeries and low TREC. (b) Relative Vb lengths for naïve (CD45RA+), memory (CD45RA−), or non-naïve Treg (CD45RA−CD25+) CD4+ T cells are displayed.
