Figure 5.
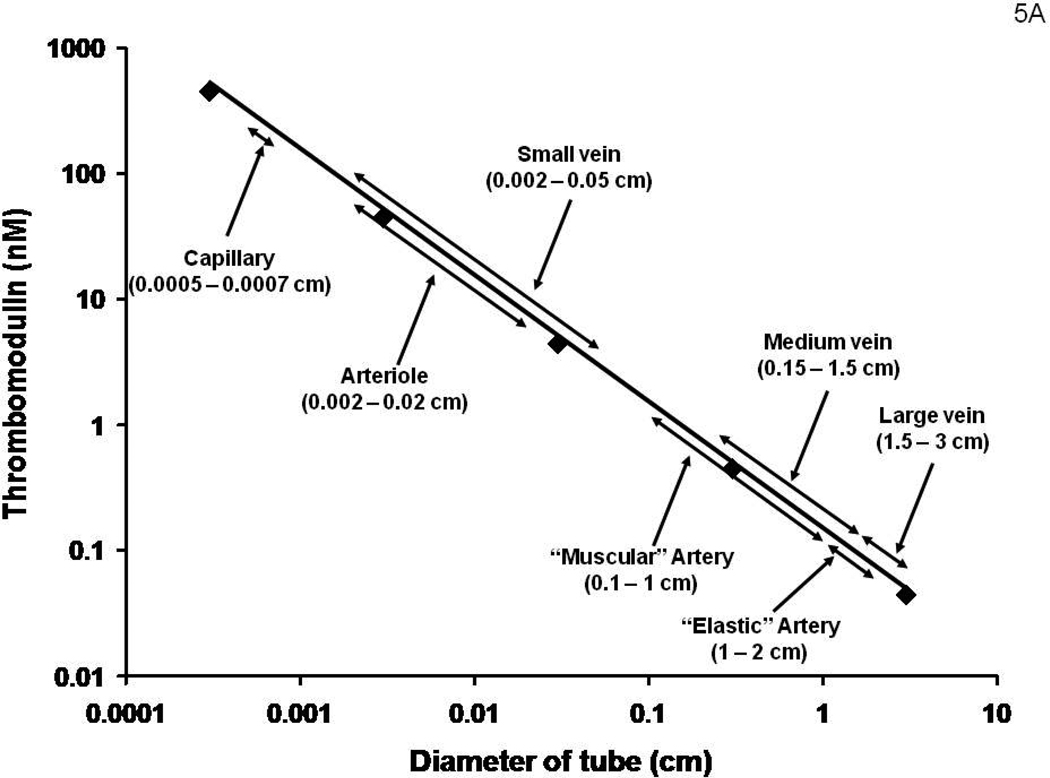
Figure 5A: A hypothetical construct displaying the potential molar concentrations of Tm in various regions of the vasculature. An underlying assumption is that the Tm concentration by each endothelial cell is independent of the vascular source.
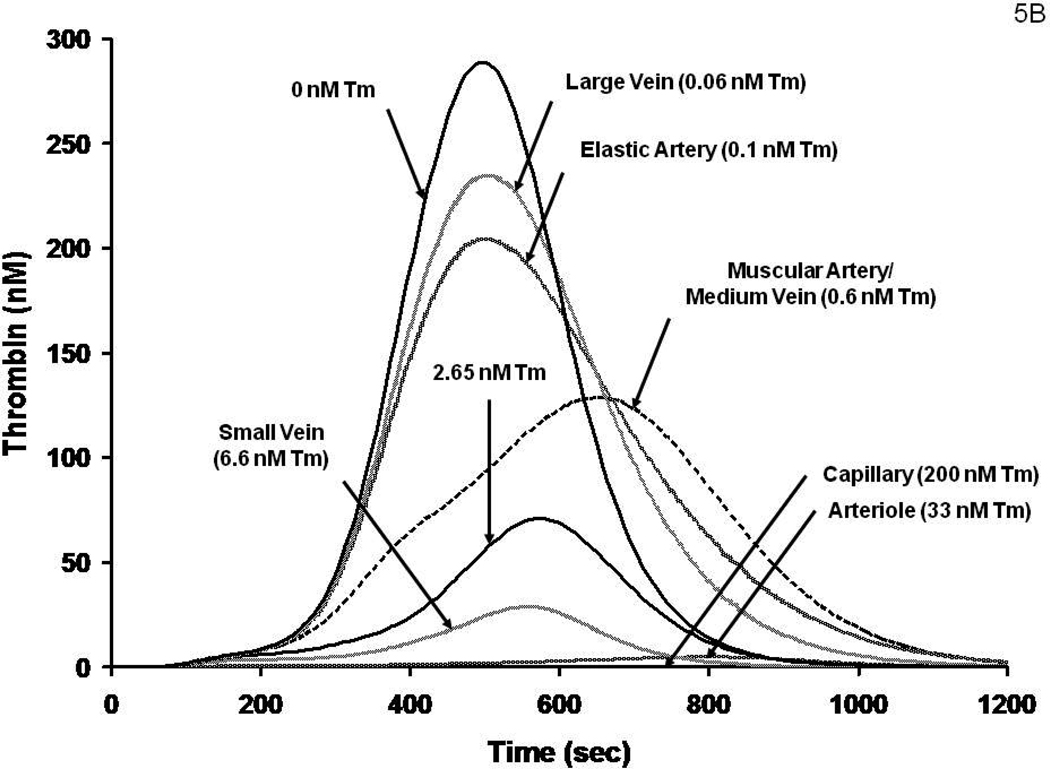
Figure 5B: A numerical simulation of thrombin generation versus time in vessels displaying the Tm concentrations estimated in Figure 5A following a Tf insult.


