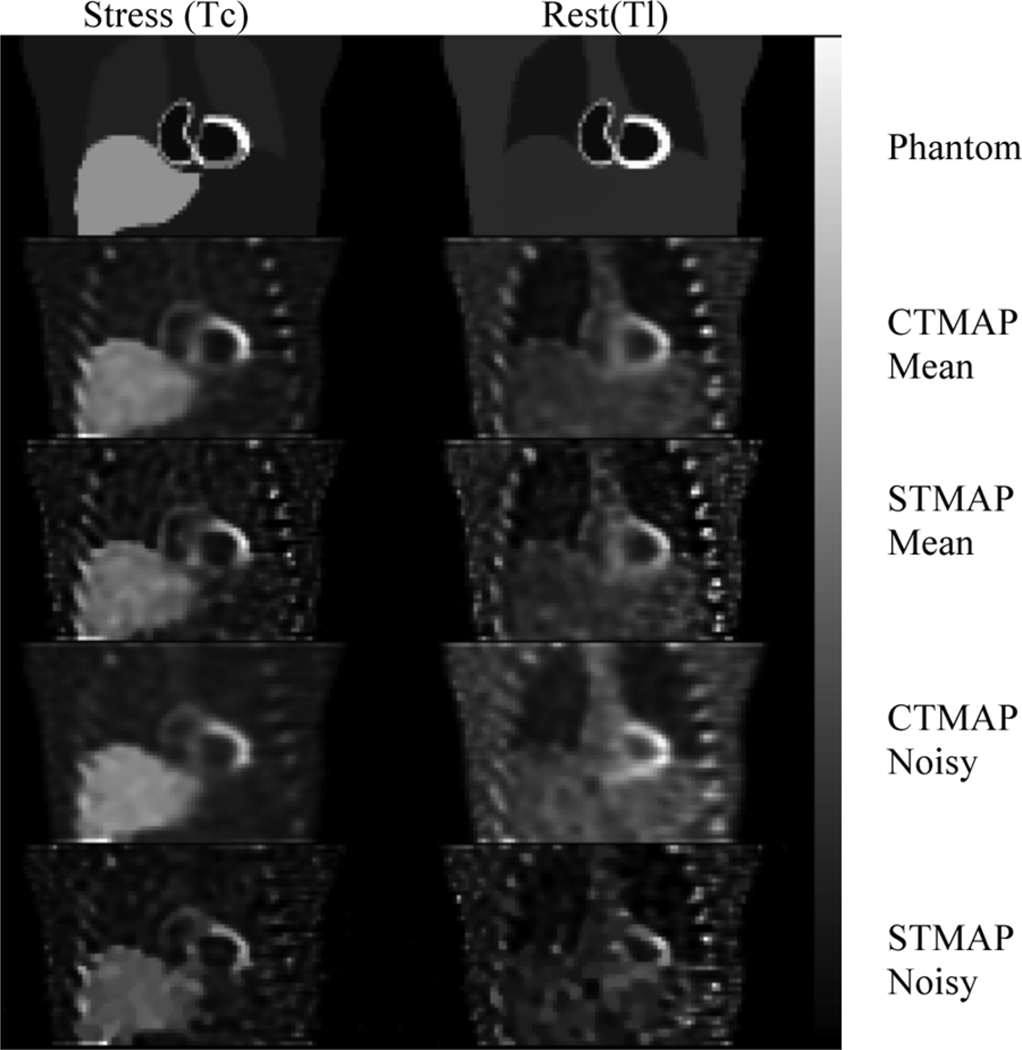
Fig. 6.
Comparison of images reconstructed using the cross-tracer (CTMAP) and single-tracer (STMAP) algorithms. The rows are, top to bottom, the phantom, mean of 50 noisy CTMAP and STMAP reconstructions, and sample noisy CTMAP and STMAP reconstructions. The columns are (left to right) images of the rest and stress distributions. A 35% contrast myocardial perfusion defect was present in the stress distribution, but there was no defect in the rest distribution. All reconstructions were obtained using 16 subsets, 100 iterations, β = 0.05, and δ = 10.

