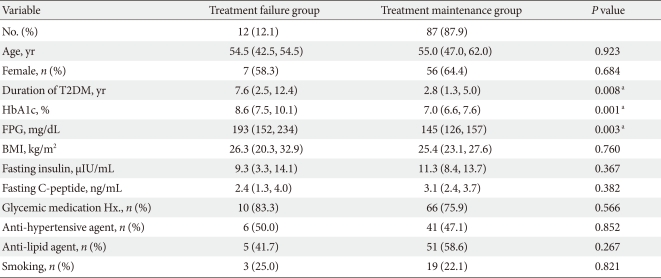
Table 3.
Baseline demographic and clinical differences between the treatment failure group and the treatment maintenance group during observation period
Data are presented as median (25% confidence interval [CI], 75% CI) or number (%).
T2DM, type 2 diabetes mellitus; BMI, body mass index.
aStatistical significances were tested by χ2--test for categorical variables and Mann-Whitney test for continuous variables.

