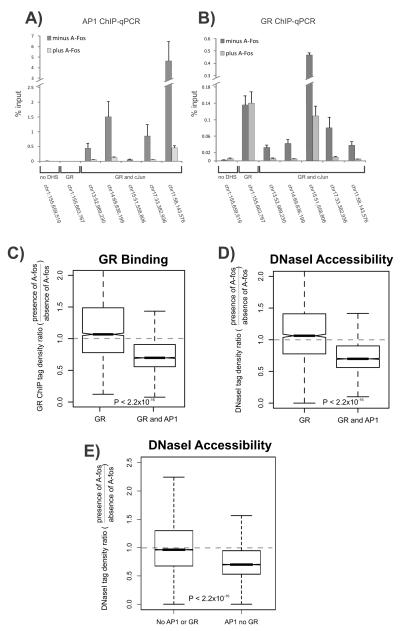
Figure 3. Abrogating AP1 binding attenuates genome-wide GR binding and chromatin accessibility.
A-B. A-fos expression reduces both GR and AP1 binding at co-bound sites. Shown are AP1 (A) and GR ChIP (B) q-PCRs performed in the absence or presence of A-fos and treated with hormone for 1hr at select sites. The following regions were analyzed: a control site which is a non-DNaseI hypersensitive site (no DHS) with no GR or AP1 binding (Chr1:155,659,519); a GR only bound site (Chr1:155,663,767) and five sites bound by AP1 and GR. Data represent the average of three biological replicates. Error bars represent standard error of the mean.
C-D. A-fos expression reduces global GR binding (C) and chromatin accessibility (D) at GR and AP1 co-bound sites. Shown are box plots of the effect of A-fos on GR binding and chromatin accessibility at sites bound by GR alone or sites bound by both GR and AP1. A-fos selectively affects sites bound by AP1 and compromises GR binding and chromatin accessibility at co-bound regions.
E. A-fos expression reduces global chromatin accessibility at AP1 bound sites, independent of GR binding. Shown are box plots of the effect of A-fos on chromatin accessibility at sites not bound by either AP1 or GR or sites bound by AP1 alone. A-fos selectively compromises endogenous AP1 binding and affects chromatin accessibility at sites bound by AP1 (see Figure S3B). For boxplots (C-E), the effect of A-fos on GR binding and chromatin accessibility is expressed as a ratio of tag densities: minus Tet (A-fos expressing) over plus Tet (no A-fos expression). Dotted line is indicative of no A-fos effect. Statistical significance was determined using a KS-test. Boxplots show the median and upper and lower quartiles. Whiskers show the minimum and maximum values. Notches denote the 95% confidence interval of the median.

