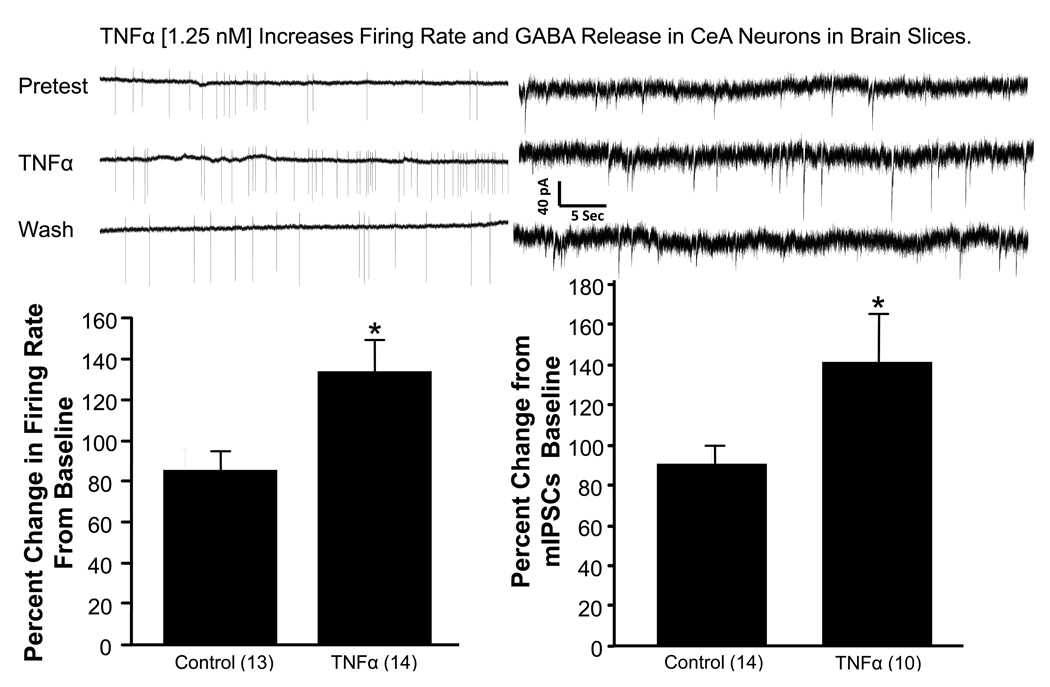
Figure 7.
Physiological responses of amygdala neurons to TNFα. Representative neuronal firing rates in a neuron from an amygdala slice preparation before, during and after TNFα (1.25 nM) exposure (upper left panel). The firing rate increase relative to the average of the pre and post-TNFα periods was significantly greater than rates obtained from non-TNFα exposed cells. A similar comparison of the effect of TNFα (1.25 nM) on GABA release in the amygdala slice is shown in the lower right panel lower right panel). Representative traces of mIPSCs are shown before, during, and after TFNα in the upper right panel. Numbers in parentheses are number of cells. mIPSCs = mini inhibitory post-synaptic currents. *p < 0.05 versus control.

