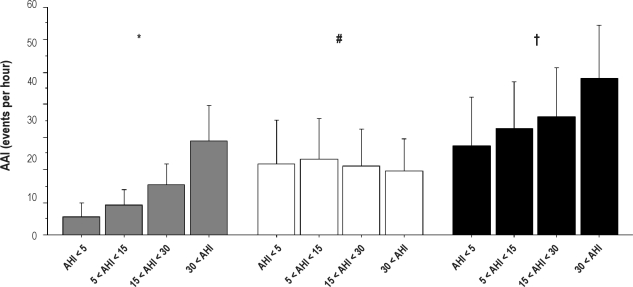
Figure 4.
Overall (black chart), respiratory (gray chart), and spontaneous (white chart) autonomic arousal index (AAI) according to the apnea-hypopnea index (AHI) group (mean ± SD). The Kruskall-Wallis test showed differences for overall, respiratory and spontaneous AAI according to AHI. *, respiratory AAI (P < 0.0001); #, spontaneous AAI (P = 0.0092); , overall AAI (P < 0.0001).

