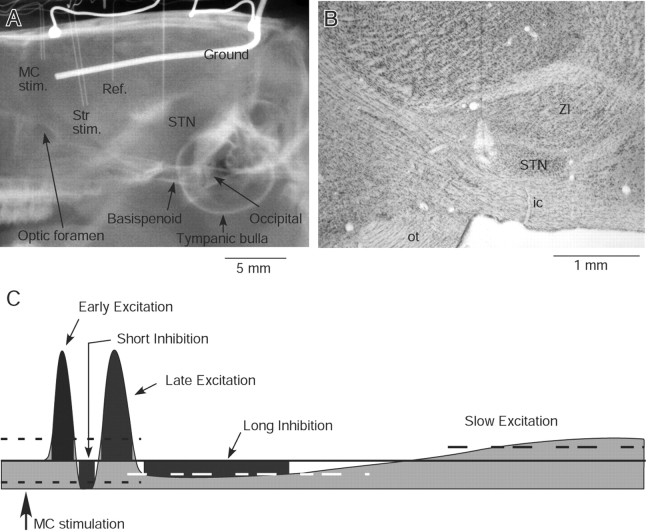
Figure 1.
A, An x-ray image shows a pair of stimulus electrodes in the motor cortex (MC stim.) and in the striatum (Str stim.), a reference (Ref.) electrode in the lateral ventricle, a recording electrode in the STN, two silver balls for electrocorticogram recording, and a ground wire located lateral to the right parietal bone. Some anatomical landmarks are also labeled. The results of Str stimulation were not included in this report. B, A photomicrograph of a Nissl-stained sagittal section shows a lesion mark in STN. ZI, Zona incerta; ic, internal capsule; ot, optic tract. C, A schematic presentation of typical MC-induced response components in the globus pallidus and STN. The heavy line and two dotted lines mark the prestimulus mean firing rate and 95% confidence interval, respectively. The short duration responses shown in the drawing exceed the confidence interval. The long inhibition and the slow excitation exceed 50% of the prestimulus mean firing rate. The dark gray area of each response component marks the latency, the duration, and the strength (i.e., the numbers of spikes that fill the area). The slow excitation was not quantified in this report.

