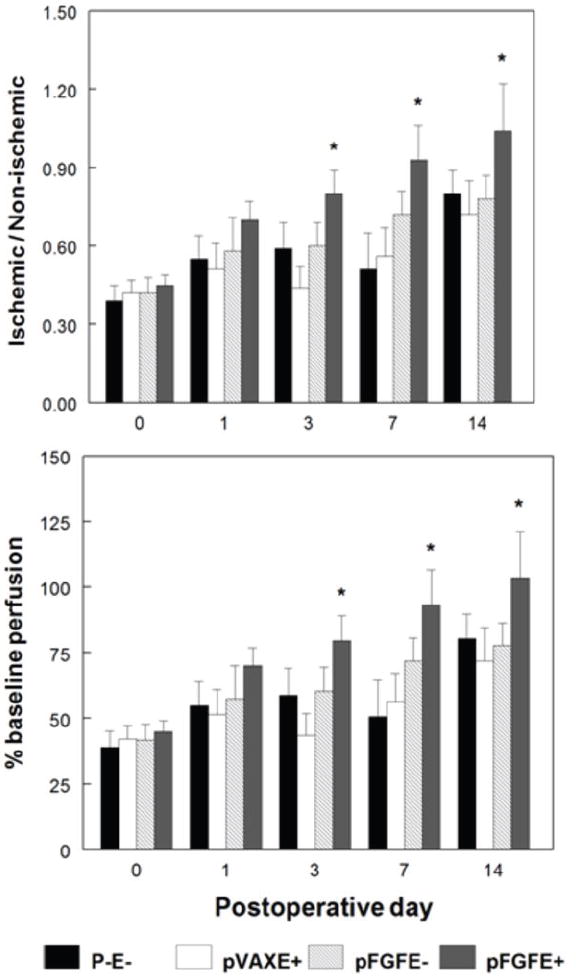
Figure 2. Effect of pFGFE+ on ischemic limb blood flow.


A, Representative laser Doppler perfusion images for the pFGFE+ and pFGFE- treatment groups at day 14 postoperatively. The white box indicates the approximate area where blood flow was assessed. The arrows indicate the absence of perfusion in the area of the femoral artery after the operation to induce hindlimb ischemia. B, Quantification of blood flow as determined by laser Doppler perfusion imaging. (Top panel) Ratio of blood flow in the ischemic limb to the non-ischemic limb (I/NI). (bottom) Postoperative blood flow as a percentage of baseline line blood flow. n=6 per group per time point. * p<0.05 compared to all controls. pFGFE+: intradermal injection of plasmid FGF-2 followed by electroporation; pFGFE-: Intradermal injection of plasmid FGF-2; pVAXE+: intradermal injection of vector backbone followed by electroporation; P-E-: no treatment.
