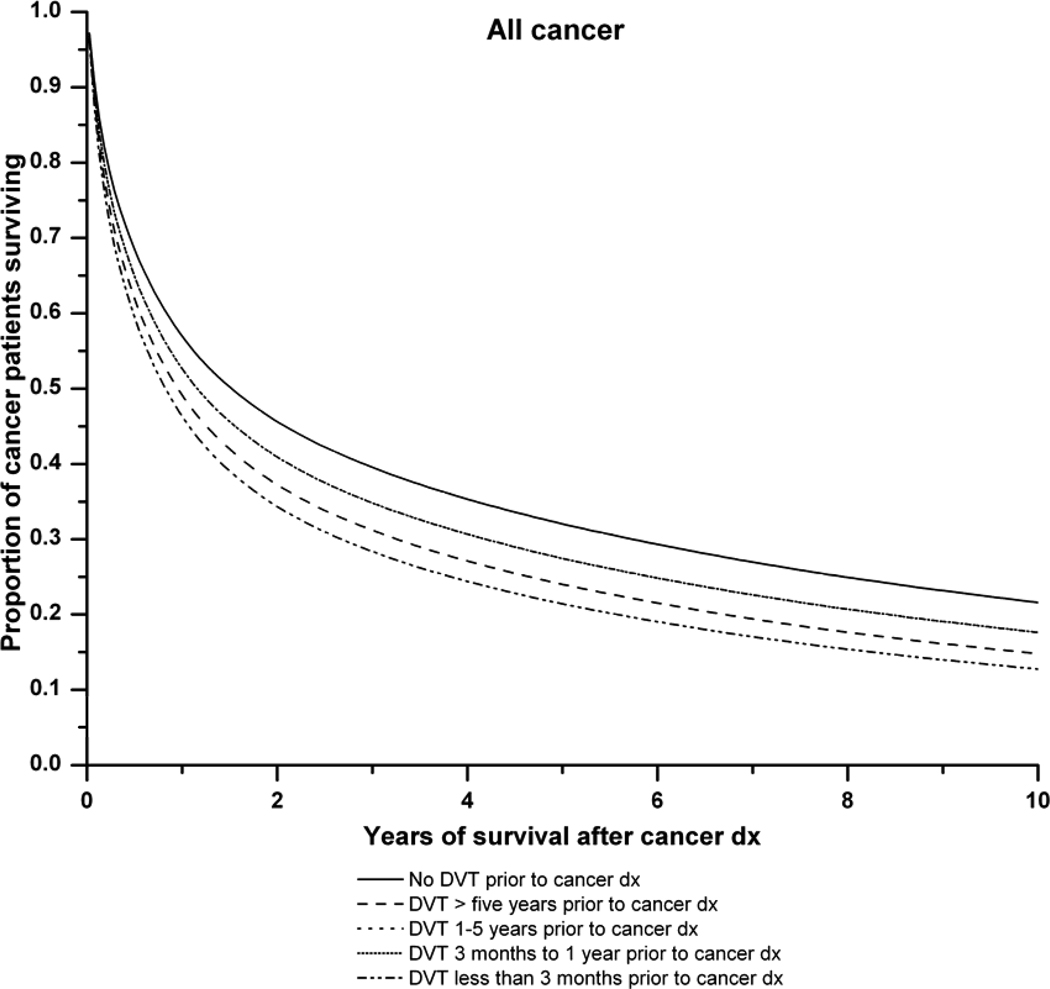
Figure 1.
A: Survival curves for all cancer patients with and without a history of deep venous thrombosis of the lower extremities (DVT). Adjusted survival curves are presented. The solid line represents cancer patients with no history of DVT. The dashed lines represent cancer patients with: DVT more than 5 years prior to cancer diagnosis ( ), DVT 1–5 years before cancer diagnosis (
 ), DVT 1 year before cancer diagnosis (
 ) and DVT at cancer diagnosis (
 ). The lines for DVT 1–5 years before cancer diagnosis and DVT 1 year before cancer diagnosis are superimposed. P-value (likelihood ratio test) for difference in survival according to pre-existing DVT status: P<0.0001.
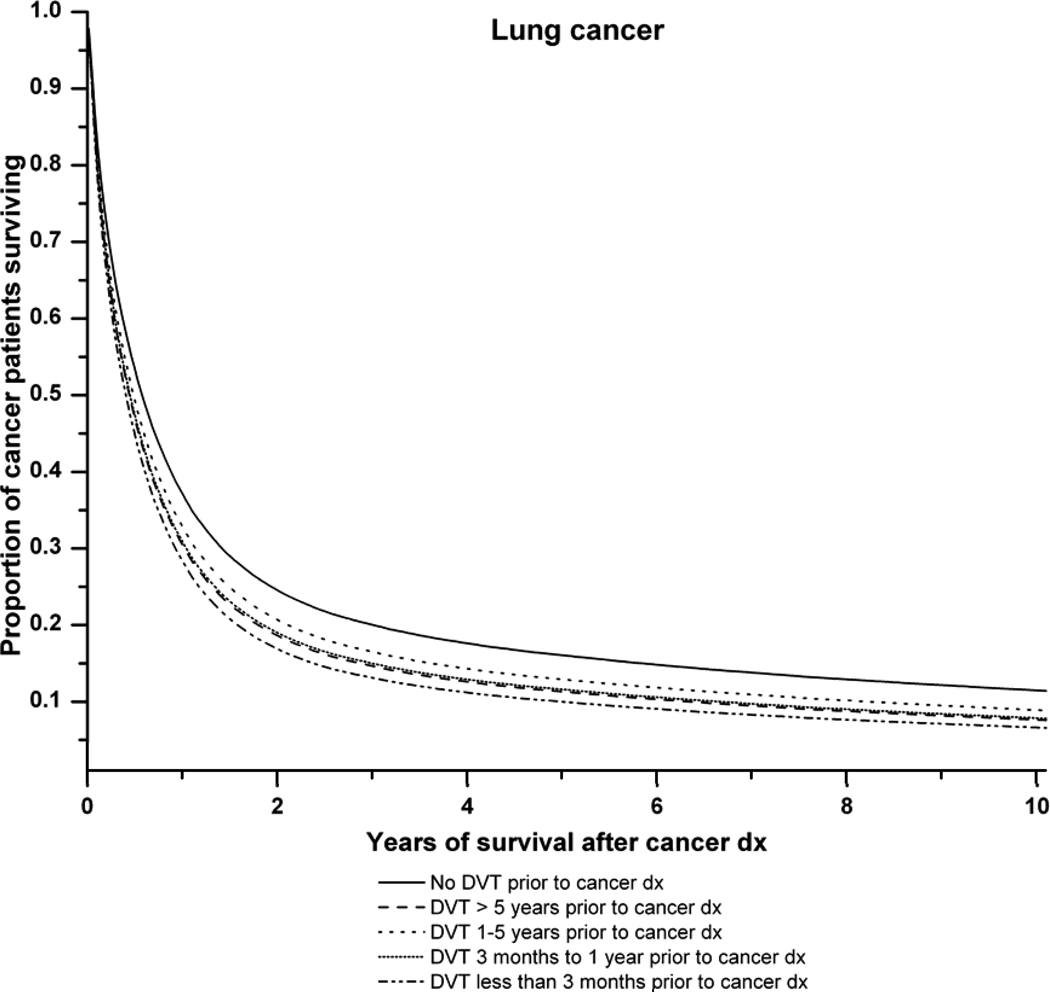
B: Survival curves for lung cancer patients with, and without, a history of deep venous thrombosis (DVT). Adjusted survival curves are presented. The solid line represents lung cancer patients with no history of DVT. The dashed lines represent lung cancer patients with: DVT more than 5 years prior to cancer diagnosis ( ), DVT 1–5 years before cancer diagnosis (
 ), DVT 1 year before cancer diagnosis (
 ) and DVT at cancer diagnosis (
 ). P-value (likelihood ratio test) for difference in survival according to pre-existing DVT status: P<0.0001.
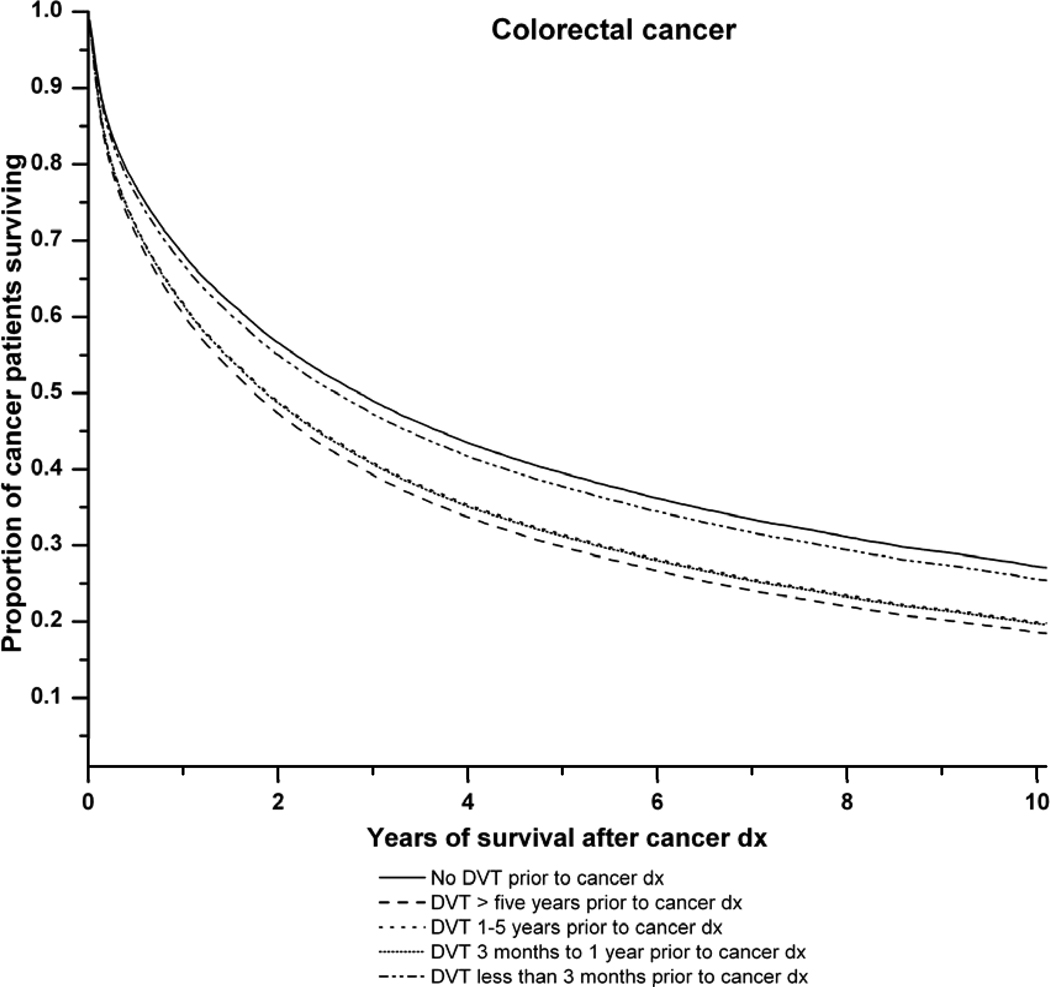
C: Survival curves for colorectal cancer patients with, and without, a history of deep venous thrombosis (DVT). Adjusted survival curves are presented. The solid line represents colorectal cancer patients with no history of DVT. The dashed lines represent colorectal cancer patients with: DVT more than 5 years prior to cancer diagnosis ( ), DVT 1–5 years before cancer diagnosis (
 ), DVT 1 year before cancer diagnosis (
 ) and DVT at cancer diagnosis (
 ). P-value (likelihood ratio test) for difference in survival according to pre-existing DVT status: P<0.0001.
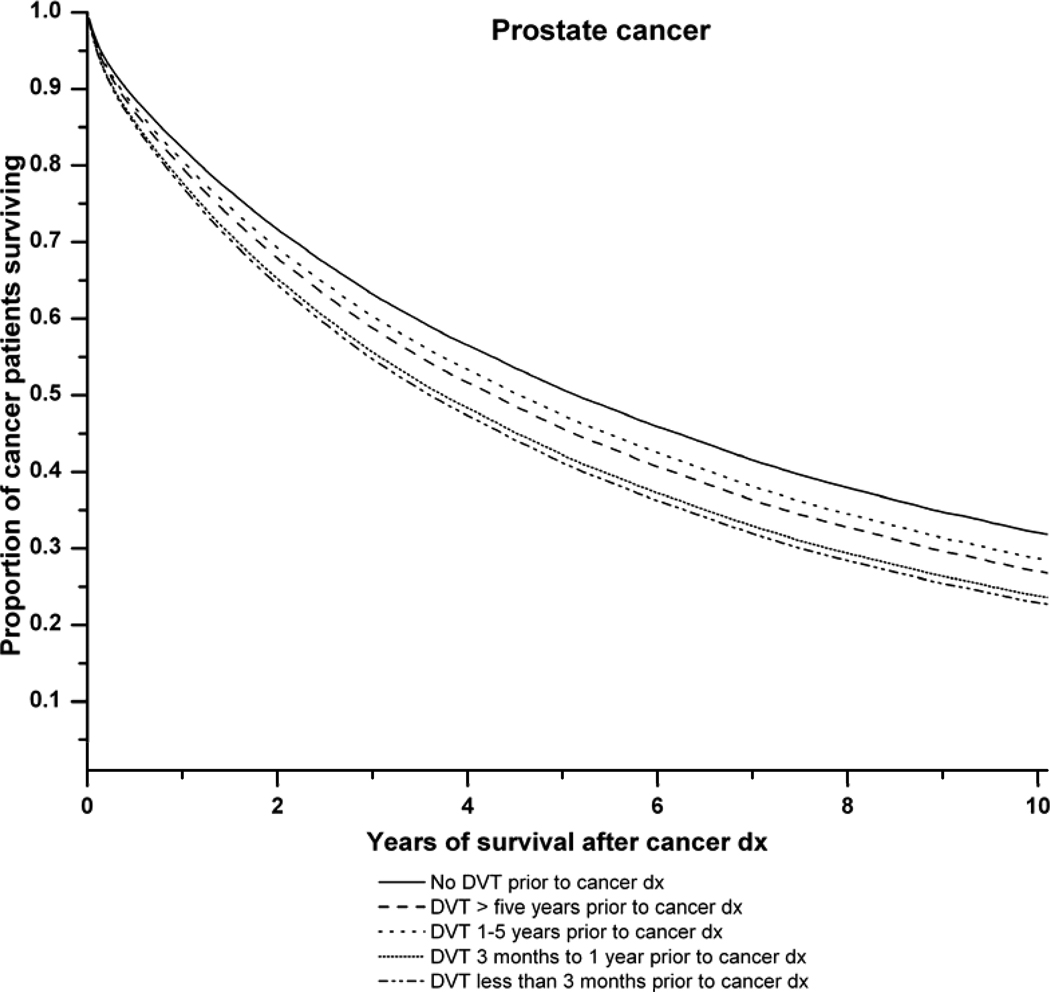
D: Survival curves for prostate cancer patients with, and without, a history of deep venous thrombosis (DVT). Adjusted survival curves are presented. The solid line represents prostate cancer patients with no family of DVT. The dashed lines represent prostate cancer patients with: DVT more than 5 years prior to cancer diagnosis ( ), DVT 1–5 years before cancer diagnosis (
 ), DVT 1 year before cancer diagnosis (
 ) and DVT at cancer diagnosis (
 P-value (likelihood ratio test) for difference in survival according to pre-existing DVT status: P<0.0001.


