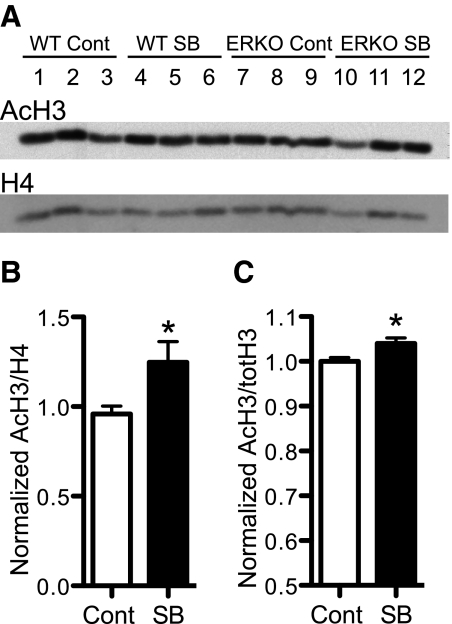
Fig. 5.
Acetylation levels of histones in brain tissue from SB treated females. A, A representative Western blot of AcH3 subunit and total H4 subunit loading control from whole-brain histone extractions of WT and ERα knockout (ERKO) littermate females both treated with SB and untreated (Cont). For each group, three individuals are shown. B, Mean ± sem level of AcH3 normalized to H4 in whole-brain histone and expressed as a fraction of the mean WT Cont levels (n = 6 per treatment group). C, Mean ± sem level of AcH3 normalized to total H3 of hypothalamic tissue from EB (Cont) and EB + SB (SB) (n = 5 in each group). *, Significantly larger than Cont groups (P < 0.05).

