Fig. 3.
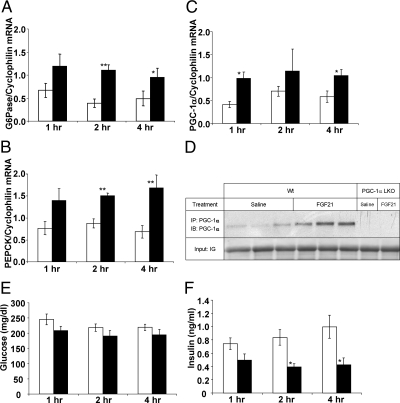
Acute FGF21 treatment increases gluconeogenic gene expression in the liver. Data are shown 1, 2, and 4 h after ip injection of saline (open bars) or FGF21 (black bars). A, Bar graph showing a significant increase in G6Pase mRNA expression 2 and 4 h after FGF21 injection. B, PEPCK mRNA expression is also significantly increased at these time points. C, PGC-1α expression is significantly increased 1 h after injection. D, Immunoprecipitation showed increased expression of PGC-1α protein under FGF21 treatment. Blot also highlights absence of PGC-1α protein in the liver of PGC-1α LKO mice. Circulating glucose (E) and insulin (F) levels are shown throughout the time course. Data are shown as mean ± sem (*, P < 0.05; **, P < 0.00). Wt, Wild type.

